Lesson 1. Introduction to APIs
Introduction to programmatic data access in R - Earth analytics course module
Welcome to the first lesson in the Introduction to programmatic data access in R module. In this module, you learn various ways to access, download and work with data programmatically. These methods include downloading text files directly from a website onto your computer and into R, reading in data stored in text format from a website, into a data.frame in R and finally, accessing subsets of particular data using REST API calls in R.Learning Objectives
After completing this tutorial, you will be able to:
- Describe the difference between human vs machine readable data structures.
- Describe the difference between data returned using an API, compared to downloading a text file directly.
- Describe 2-3 components of a RESTful API call.
- List 3 different ways to access data programmatically from R: using
download.file(),read.csv()and an API call.
What You Need
You will need a computer with internet access to complete this lesson.
Access Data Programmatically
This week you will learn programmatic access of data using:
- Direct downloads / import of data.
- Applied Programming Interfaces (APIs).
Up until this point, you have been downloading data from a website (in the case of
this course, Figshare) independently.
Then you work with the data in R. The data that you have downloaded
are prepared specifically for this course. However, independently downloading
and unzipping data, each week is not efficient and does not explicitly tie your
data to your analysis.
You can automate the data download process using R. Automation is particularly useful
when:
- You want to download lots of data or particular subsets of data to support an analysis.
- If and when there are programmatic ways to access and query the data online.
Link Data Access to Processing & Analysis
When you automate data access, download or retrieval and embed it in your code, you are directly linking your analysis to your data. Further combined with R markdown reports, code comments and expressive coding techniques, you are better documenting your workflow. In short - by linking data access and download to your analysis - you are not only reminding your future selves of your process - you are also reminding your future self where (and how) you got the data in the first place!
Three Ways to Access Data
You can break up programmatic data access into three general categories:
- Data that you download directly by calling a specific URL and or by using the
download.file()function call. - Data that you directly import into R using a call to
read.csv()orread.table(). - Data that you download using an API which makes a request to a data repository and returns requested data.
Two Key Formats
The data that you access programmatically may be returned in one of two main formats:
- Tabular Human-readable file: Files that are tabular, include csv’s (Comma Separated Values) and even spreadsheets (Microsoft Excel, etc.). These files are organized into columns and rows and “flat” in structure rather than hierarchical.
- Structured Machine-readable files: Files that are sometimes stored in a text format but are hierarchical and structured in some way that optimizes machine readability.
Data Tip: There are non text formatted hierarchical data structures that you will not learn in this module. One example of this is the hdf5 data model (structure).
Download Files Programmatically
In week one of this course, you downloaded some data using the download.file()
function. In this case, you accessed data programmatically, but you first downloaded
it as a .csv to your computer, and then proceeded to open it and work with it in
R.
# download text file to a specified location on your computer
download.file(url = "https://ndownloader.figshare.com/files/7010681",
             destfile = "data/week-13/boulder-precip-aug-oct-2013.csv")
# read data into R
boulder_precip <- read.csv("data/week-13/boulder-precip-aug-oct-2013.csv")
| X | DATE | PRECIP |
|---|---|---|
| 756 | 2013-08-21 | 0.1 |
| 757 | 2013-08-26 | 0.1 |
| 758 | 2013-08-27 | 0.1 |
| 759 | 2013-09-01 | 0.0 |
| 760 | 2013-09-09 | 0.1 |
| 761 | 2013-09-10 | 1.0 |
| 762 | 2013-09-11 | 2.3 |
| 763 | 2013-09-12 | 9.8 |
| 764 | 2013-09-13 | 1.9 |
| 765 | 2013-09-15 | 1.4 |
| 766 | 2013-09-16 | 0.4 |
| 767 | 2013-09-22 | 0.1 |
| 768 | 2013-09-23 | 0.3 |
| 769 | 2013-09-27 | 0.3 |
| 770 | 2013-09-28 | 0.1 |
| 771 | 2013-10-01 | 0.0 |
| 772 | 2013-10-04 | 0.9 |
| 773 | 2013-10-11 | 0.1 |
download.file()
When you use the download.file() function, you are telling R to save a copy of the
file that you access online, locally, on your computer. Thus you only need to
run this function once or more if the data change given you have the data stored
locally in your working directory.
read.csv()
You can also use the read.csv() function to import data directly into R. You will
learn more about this in the next lesson. Note that when you read data into R using
read.csv() you are not saving a copy of your data locally, on your computer - you
are importing the data directly into R. If you want a copy of the computes data to
use for future analysis without directly importing it you will need to export the
data to your working directory using write.csv().
Human Readable Data
Notice that the data that you downloaded above using download.file() are
tabular and thus human-readable. The data are in a tabular structure,
with rows and columns that you can quickly understand. R can import these data
into a data.frame and you can work with it programmatically in R.
However, what happens if your data structure is more complex? For example, what if you wanted to store more information about each measured precipitation data point? Your table could get very wide very quickly making is less readable but also more computationally intensive to process.
You will learn about structured machine readable data structures later in this module which may be hard for humans to quickly digest when you look at them but are much more efficient to process - particular as your data get large.
What is an API?
An API (Applied Programming Interface) is an interface that sits on top of a computer based system and simplifies certain tasks such as - extracting subsets of data from a large repository or database.
Using Web-APIs
Web API’s allow you to access data available via an internet web interface.
Often you can access data from web APIs using a URL that contains sets of parameters that specifies the type and particular subset of data that you are interested in.
If you have worked with a database such as SQL or POSTSQL, or if you’ve ever
queried data from a GIS system like ArcGIS, then you can compare the set of
parameters associated with a URL string to a SQL query.
Web APIs are a way to strip away all the extraneous visual interface that you don’t care about and get the data that you want.
Why You Use Web APIs
Among other things, APIs allow us to:
- Get information that would be time-consuming to get otherwise.
- Get information that you can’t get otherwise.
- Automate an analytical workflows that require continuously updated data.
- Access data using a more direct interface.
Three Parts of an API Request
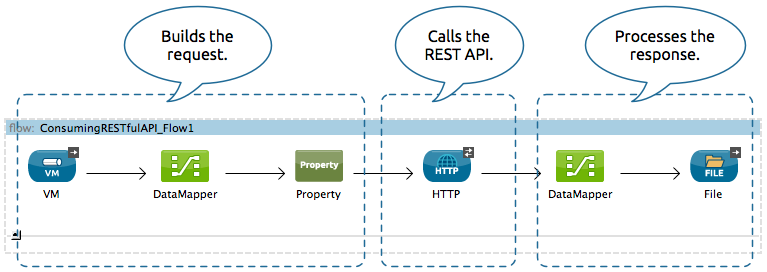
When we talk about API’s it’s important to understand two key components: the request and the response. The third part listed below is the intermediate step where the request is PROCESSED by the remote server.
- Data REQUEST: You try to access a
URLin your browser that specifies a particular subset of data. - Data processing: A web server somewhere uses that url to query a specified dataset.
- Data RESPONSE: That web server then sends you back some content.
The response may give you one of two things:
- Some data or
- An explanation of why your request failed
API Endpoints
When we talk about an endpoint, we are referring to a datasource available through an API. These data may be census data, geospatial base maps, water quality or any type of data that has been made available through the API.
Restful Web APIs
There are many different types of web APIs. One of the most common types is
a REST, or RESTful, API. A RESTful API is a web API that uses
URL arguments to specify what information you want returned through the API.
To put this all into perspective, next, you will explore a RESTful API interface example.
Colorado Population Projection Data
The Colorado Information Marketplace is a data warehouse that provides access to a wide range of Colorado-specific open datasets available via a RESTful API called the Socrata Open Data API (SODA)
There are lots of API endpoints or data sets available through this API.
- Check some of the data available on the site out in the browse section of the website.
- Check out the available demographic data.
- Colorado population projects data landing page.
One endpoint contains Colorado Population Projection data.
If you click on the link to the CO Population projection data, you will see data returned
in a JSON format.
JSON is a structured, machine readable format. You will learn more about
it in the next lesson.
Population Data Request and Response
The CO population project data contain projected population estimates for males and females for every county in Colorado for every year from 1990 to 2040 for multiple age groups.
Phew! In the previous sentence, you just specified all of the variables stored within these data. These variables can be used to query the data! This is your data request.
Below, you see a small subset of the response that you get from a basic request
with no URL parameters specified - https://data.colorado.gov/resource/tv8u-hswn.json.
Notice that the response in this case is returned in JSON format.
[{"age":"0","county":"Adams","femalepopulation":"2404.00","fipscode":"1","malepopulation":"2354.00","totalpopulation":"4758","year":"1990"}
,{"age":"1","county":"Adams","femalepopulation":"2375.00","fipscode":"1","malepopulation":"2345.00","totalpopulation":"4720","year":"1990"}
,{"age":"2","county":"Adams","femalepopulation":"2219.00","fipscode":"1","malepopulation":"2413.00","totalpopulation":"4632","year":"1990"}
,{"age":"3","county":"Adams","femalepopulation":"2261.00","fipscode":"1","malepopulation":"2321.00","totalpopulation":"4582","year":"1990"}
,{"age":"4","county":"Adams","femalepopulation":"2302.00","fipscode":"1","malepopulation":"2433.00","totalpopulation":"4735","year":"1990"},
...
]
URL Parameters
Using URL parameters, you can define a more specific request to limit what data
you get back in response to your API request. For example, you can query the data
to only return data for Boulder County, Colorado using the RESTful call.
Data Tip: Note the ?&county=Boulder part of the url below. That is an important part of the API
request that tells the API to only return a subset of the data - where county = Boulder. https://data.colorado.gov/resource/tv8u-hswn.json?&county=Boulder
Like this: https://data.colorado.gov/resource/tv8u-hswn.json?&county=Boulder.
Notice that when you visit the URL above and in turn request the data for Boulder County, you see that now the response is filtered to only include Boulder County data.
[{"age":"66","county":"Boulder","femalepopulation":"649","fipscode":"13","malepopulation":"596","totalpopulation":"1245","year":"1997"}
,{"age":"78","county":"Boulder","femalepopulation":"427","fipscode":"13","malepopulation":"258","totalpopulation":"685","year":"1992"}
,{"age":"85","county":"Boulder","femalepopulation":"265","fipscode":"13","malepopulation":"110","totalpopulation":"375","year":"1991"}
,{"age":"74","county":"Boulder","femalepopulation":"516","fipscode":"13","malepopulation":"373","totalpopulation":"889","year":"1996"},
...
]
Parameters associated with accessing data using this API are documented here.
Using the SODA RESTful API
The SODA RESTful API also allows us to specify more complex ‘queries’. Here’s
the API URL for population projections for females who live in Boulder that
are between the ages of 20–40 for the years 2016–2025:
https://data.colorado.gov/resource/tv8u-hswn.json?$where=age between 20 and 40 and year between 2016 and 2025&county=Boulder&$select=year,age,femalepopulation
[{"age":"32","femalepopulation":"2007","year":"2024"}
,{"age":"35","femalepopulation":"1950","year":"2016"}
,{"age":"37","femalepopulation":"2039","year":"2019"}
,{"age":"30","femalepopulation":"2087","year":"2025"}
,{"age":"26","femalepopulation":"1985","year":"2019"}
,{"age":"22","femalepopulation":"3207","year":"2016"}
...
]
Click here to view the full API response.
Breaking Down an API String
Notice that the colorado.data.gov API URL above, starts with
data.colorado.gov but then has various parameters attached to the end of the URL
that specify the particular type of information that you are looking for.
A few of the parameters that you can see in the url are listed below:
- The Data set itself: /tv8u-hswn.json
- AGE: where=age between 20 and 40
- YEAR: year between 2016 and 2025
- COUNTY: county=Boulder
- Columns to get: select=year,age,femalepopulation
JSON Structured Text Format API Response
The response data that are returned from this API are in a text format, structured
using JSON.
Data Tip: Many APIs allow you to specify the file format that you want to be returned. Learn more about how this works with the CO data warehouse here.
Notice that the first few rows of data returned via the query above with a .csv
suffix look like this:
"age","femalepopulation","year"
"32","2007","2024"
"35","1950","2016"
"37","2039","2019"
"30","2087","2025"
"26","1985","2019"
...
Here is a different application of the same type of API. Here, the website developers have built a tabular viewer that we can use to look at and interact with the population data. These data are the same data that you can download using the REST API url string above. However, the developers have wrapped the API in a cool interface that allows us to view the data directly, online.
You will work with these data in R directly in the following lessons, but for now
just notice how the API access works in this case.
- Data REQUEST: You try to access a
URLin your browser. - Data processing: A web server somewhere uses that url to query a specified dataset.
- Data RESPONSE: That web server then sends you back some content.
Optional Challenge
Explore creating SODA API calls to the Colorado data warehouse. Go to the bottom of the page and check out each variable that you can query on.
Additional Resources
More About JSON
Using APIs
So, how do you learn more about APIs? Below are some resources …
- Find APIs and read more about them
- Twitter API Documentation
- New York Times API Information
- Weather Underground API Information
- EnviroCar API Information
The documentation in the URL’s above describes the different types of requests
that you can make to the data provider. For each request URL you need to specify
the parameters and consider the response.
Share on
Twitter Facebook Google+ LinkedIn
Leave a Comment