Lesson 1. Introduction to R Markdown & Knitr - Connect Data, Methods and Results
Link data, processing and results using R Markdown and knitr - Earth analytics course module
Welcome to the first lesson in the Link data, processing and results using R Markdown and knitr module. This module reviews how to use R Markdown and knitr to create and publish dynamic reports that both link analysis, results and documentation and can be easily updated as data and methods are modified / updates.In this tutorial you will use the knitr and R Markdown packages in
RStudio to create a report that links your analysis, results and associated data.
Learning Objectives
At the end of this activity, you will be able to:
- List benefits of using
R Markdownto create reports. - Explain how R Markdown is a useful tool in Open Science approaches.
- Explain one way that
R Markdowncan benefit your research.
What You Need
Before you start this tutorial, be sure that you have R and R studio set up on
your computer. Also we recommend that you have an earth-analytics directory
set up on your computer with a /data directory with it. Follow the links below
for help getting R, RStudio and your data directory set up.
Why Open Science
Open science in a nutshell is about making scientific methods, data and outcomes available to everyone. It can be broken down into several parts (Gezelter 2009) including:
- Transparency in experimental methodology, observation, and collection of data.
- Public availability and reusability of scientific data.
- Public accessibility and transparency of scientific communication.
- Using web-based tools to facilitate scientific collaboration.
In this tutorial, you are not going to learn all aspects of open science as listed above. However, you will learn one tool that can be used to make your workflows:
- More transparent.
- More available and accessible to the public and your colleagues.
In this tutorial, you will learn how to document your work - by connecting data,
methods and outputs in one or more reports or documents. You will learn the
R Markdown file format which can be used to generate reports that connect your
data, code (methods used to process the data) and outputs. You will use the
rmarkdown and knitr package to write R Markdown files in Rstudio and
publish them in different formats (html, pdf, etc).
Open Science Slideshow
Click through the slideshow below to learn more about open science. View Slideshow: Share, Publish & Archive Code & Data
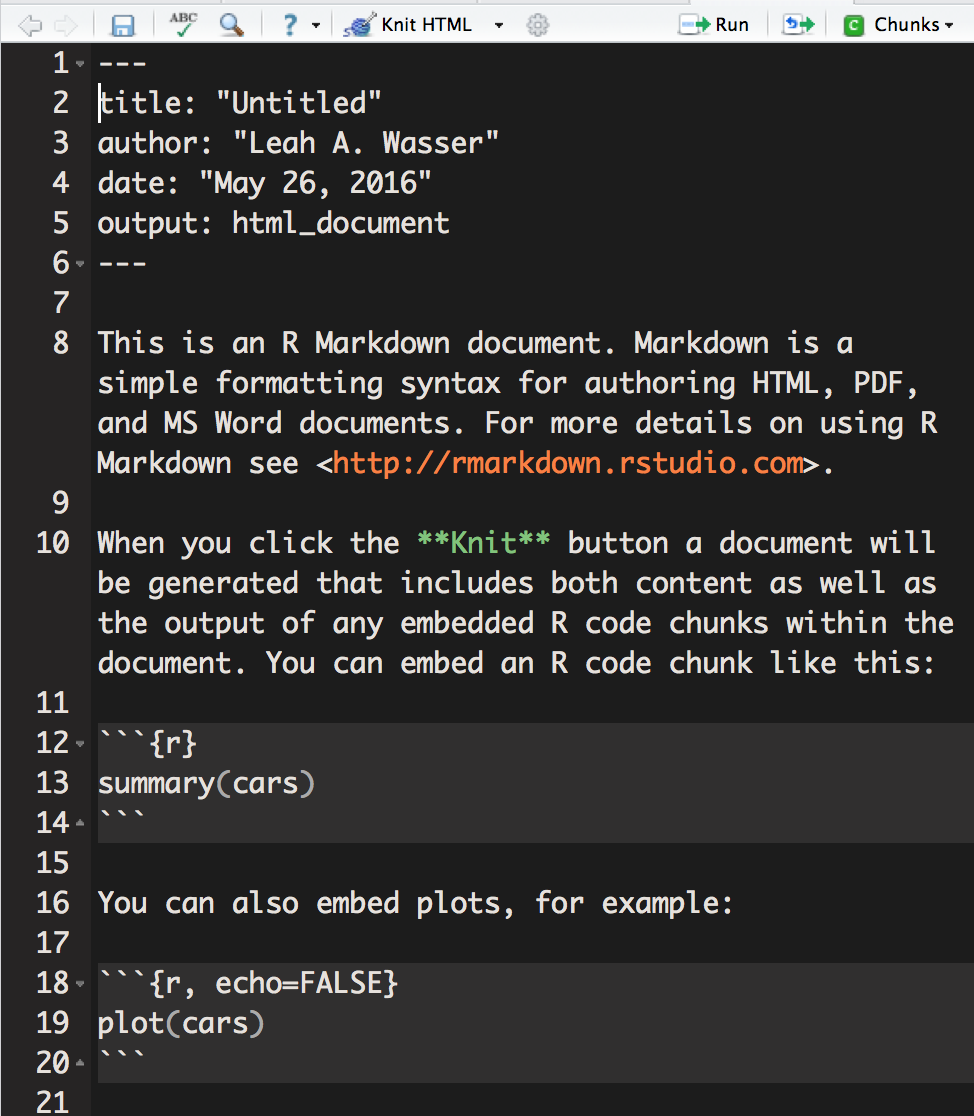
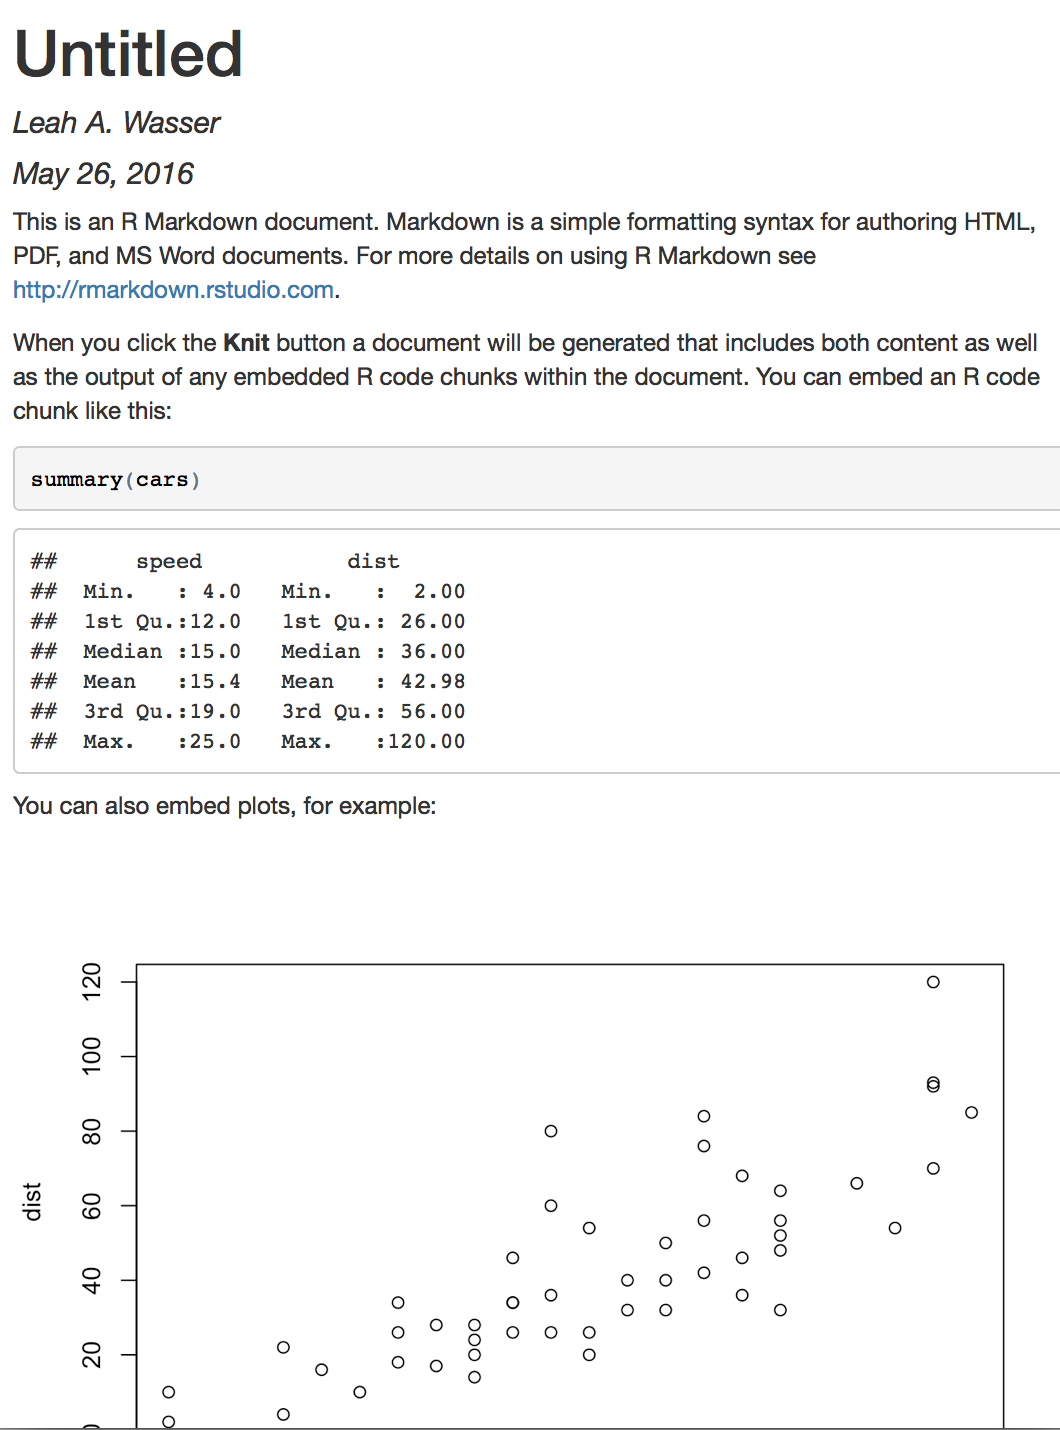
About R Markdown
Simply put, .Rmd is a text based file format that allows you to include both
descriptive text, code blocks and code output. You can run the code in R and
using a package called knitr (which you will learn about next) you can export the
text formated .Rmd file to a nicely rendered, shareable format like pdf or html.
When you knit (or use knitr) the code is run and so your code outputs including
plots, and other figures appear in the rendered document.
R Markdown (.Rmd) is an authoring format that enables easy creation of dynamic documents, presentations, and reports from R. It combines the core syntax of markdown (an easy to write plain text format) with embedded R code chunks that are run so their output can be included in the final document. R Markdown documents are fully reproducible (they can be automatically regenerated whenever underlying R code or data changes).” – RStudio documentation.
You use R Markdown(.Rmd) files to document workflows and to share data processing,
analysis and visualization code & outputs.
Why R Markdown?
There are many advantages to using R Markdown in your work:
- Human readable: It’s much easier to read a web page or a report containing text and figures.
- Simple syntax: Markdown and
.Rmdcan be learned quickly. - A Reminder for Your Future Self All components of your work are clearly documented. You don’t have to rememberwhat steps, assumptions, tests were used.
- Easy to Modify: You can easily extend or refine analyses by modifying existing or adding new code blocks.
- Flexible export formats: Analysis results can be disseminated in various
formats including
html,pdf, slide shows and more. - Easy to share: Code and data can be shared with a colleague to replicate the workflow.
Data tip: RPubs is a one way to share and publish code online.
RMD is Beneficial to Your Colleagues
The link between data, code and results make .Rmd powerful. You can share your
entire workflow with your colleagues and they can quickly see your process. You
can also write reports using .Rmd files which contain code and data
analysis results. To enrich the document, you can add text, just like you would
in a word document that describes your workflow, discusses your results and
presents your conclusions - along side your analysis results.
RMD is Beneficial to You & Your Future Self
R Markdown as a format is an efficient tool. If you need to make changes to your workflow, you can simply modify the report and re-render (or knit) the report. This creates an efficient workflow. Your future self will appreciate it too. R Markdown provides documentation for you to see what code you used to create a figure or to analyze the data.
Data Tip: Many of the Earth Lab lessons- including this one - were created using R Markdown!
Use Knitr to Convert .Rmd to .html
You use the R knitr package to render your markdown and create easy to read
documents from .Rmd files. You will learn how to use knitr later in this
lesson series.
Share on
Twitter Facebook Google+ LinkedIn
Leave a Comment