Lesson 3. Access Secure Data Connections Using the RCurl R Package.
Learning Objectives
After completing this tutorial, you will be able to:
- Access data from a secure website using
read.csv(). - Be able to describe the key difference between a
.tsvand a.csvfile. - Use pipes (
%>%) to send data directly to ggplot to plot!
What You Need
You will need a computer with internet access to complete this lesson and the data that you already downloaded for week 13 of the course.
# load libraries
library(dplyr)
library(ggplot2)
# optional
library(RCurl)
Download gapminder Data with RCurl
Next, you will download data from a secure URL. It is important to note that in older versions of R, particularly on Windows machine, you would need to use functions in the RCUrl package that support secure URL connections. Below you can read more about using RCurl to access secure URL’s. However for this lessons, you will continue to use read.csv() to directly access the data given it works for secure connections now.
Gapminder Data
Let’s grab a gapminder data subset from a secure URL located on a GitHub website. The Gapminder data, contain a suite of census-like metrics that describe global development. The data are ideal to experiment with when learning about plotting and working with data in a tool like R.
@jennybryan provides an R package to access the Gapminder data for teaching. However, you will instead use RCurl to get it from Jenny Bryan’s Github Page to practice using RCurl functions.
# Store base url (note the secure -- https:// -- url)
file_url <-  "https://raw.githubusercontent.com/jennybc/gapminder/master/inst/extdata/gapminder.tsv"
# import the data!
gap_data <-  read.csv(file_url)
head(gap_data)
##             country.continent.year.lifeExp.pop.gdpPercap
## 1  Afghanistan\tAsia\t1952\t28.801\t8425333\t779.4453145
## 2  Afghanistan\tAsia\t1957\t30.332\t9240934\t820.8530296
## 3   Afghanistan\tAsia\t1962\t31.997\t10267083\t853.10071
## 4  Afghanistan\tAsia\t1967\t34.02\t11537966\t836.1971382
## 5 Afghanistan\tAsia\t1972\t36.088\t13079460\t739.9811058
## 6   Afghanistan\tAsia\t1977\t38.438\t14880372\t786.11336
Looking at the results, you notice there is a \t between each data element. This is not what you would expect when you import file into R. What is going on?
.tsv File Format
Note that the data format that you are using here is .tsv - which stands for Tab Separate Values. The difference between .tsv and .csv is the separator:
.csvuses a COMMA (,) to separate individual values in each column and row of the data..tsvuses a TAB (\t) to separate individual values in each column / row of the data.
You can use the read.csv() function to read in the .tsv format. However, you need to tell R what the separator is. In this case it’s \t. You can account for this separator with the sep = argument.
# Use textConnection to read content of temp as tsv
gap_data <- read.csv(file_url,
                     sep = "\t")
head(gap_data)
##       country continent year lifeExp      pop gdpPercap
## 1 Afghanistan      Asia 1952   28.80  8425333     779.4
## 2 Afghanistan      Asia 1957   30.33  9240934     820.9
## 3 Afghanistan      Asia 1962   32.00 10267083     853.1
## 4 Afghanistan      Asia 1967   34.02 11537966     836.2
## 5 Afghanistan      Asia 1972   36.09 13079460     740.0
## 6 Afghanistan      Asia 1977   38.44 14880372     786.1
That looks better.
Get Data with getURL()
If you have issues using read.csv(), you can try the code below which uses the RCurl library. In past versions of R, Windows users often had issues with secure URLs in R.
# You can use textConnection() to read a file in as a text file
# however it is likely that you won't need to use it.
gap_data = read.csv(textConnection(gapminder_data_url),
                     sep = "\t")
head(gap_data)
Secure url’s in R
Use RCurl to Download Data From Secure URLs
When you run into errors downloading data using read.csv(), you may need to instead use functions in the RCurl package. RCurl is a powerful package that:
- Provides a set of tools to allow
Rto act like a web client. - Provides a number of helper functions to grab data files from the web.
The getURL() function works for most secure web download protocols (e.g., http(s), ftp(s)). It also helps with web scraping, direct access to web resources, and even API data access.
Using getURL and textConnection()
Older versions of R, particularly running Windows used to have issues with dealing with secure (https and ftps) connetion URLs. If you encounter issues importing the above data using read.table() directly, consider the following approach which uses getURL() to access the URL and the textConnection() function to read in text formatted data.
The RCurl R package, allows you to consistently access secure servers and also has additional authentication support. To use getURL() to open text files you do the following:
- You grab the URL using
getURL(). - You read in the data using
read.csv()(orread.table()) via thetextConnection()function.
# Store base url (note the secure -- https:// -- url)
file_url <- "https://raw.githubusercontent.com/jennybc/gapminder/master/inst/extdata/gapminder.tsv"

gap_data_url <- getURL(file_url)

# grab the data vis textConnection
gap_data <- read.csv(textConnection(gap_data_url),
                     sep = "\t")
head(gap_data)
##       country continent year lifeExp      pop gdpPercap
## 1 Afghanistan      Asia 1952   28.80  8425333     779.4
## 2 Afghanistan      Asia 1957   30.33  9240934     820.9
## 3 Afghanistan      Asia 1962   32.00 10267083     853.1
## 4 Afghanistan      Asia 1967   34.02 11537966     836.2
## 5 Afghanistan      Asia 1972   36.09 13079460     740.0
## 6 Afghanistan      Asia 1977   38.44 14880372     786.1
Note that textConnection() function is a base R that tells R that the data that you are accessing should be read as a text file. If you have trouble importing the data directly using read.csv(), you can try this as an option.
Data Tip: The syntax package::functionName() is a common way to tell R to use a function from a particular package. In the example above: you specify that you are using getURL() from the RCurl package using the syntax: RCurl::getURL(). This syntax is not necessary to call getURL UNLESS there is another getURL() function available in your R session.
Summarize and Plot the Data
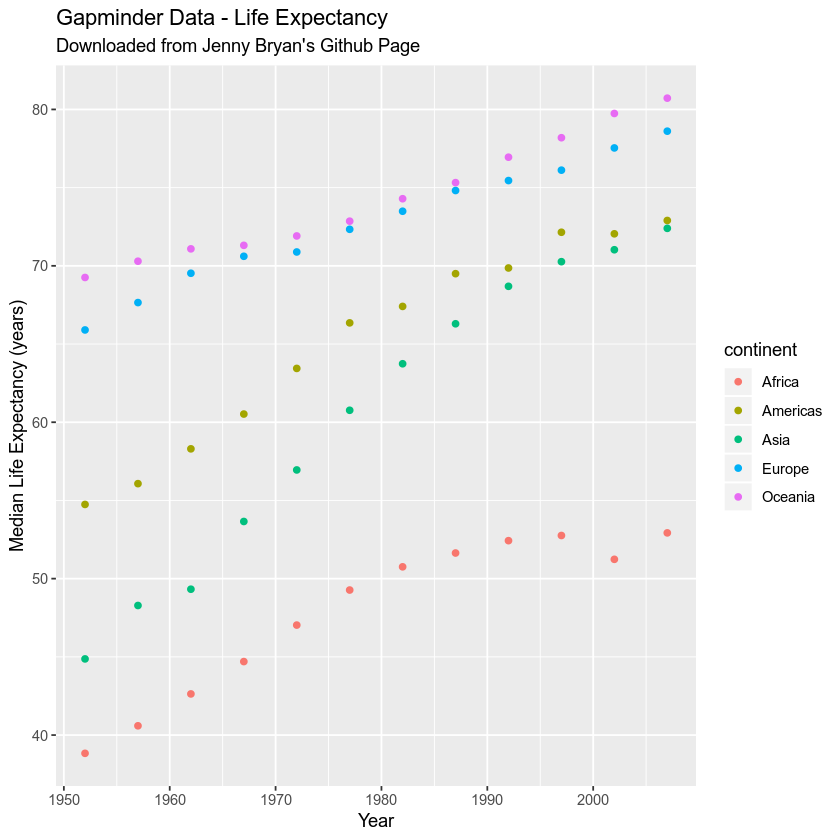
Next, you can summarize and plot the data! Notice that when you import the data from github, using read.csv(), it imports into a data.frame format. Given it’s a data.frame, you can plot the data using ggplot() like you are used to.
Below, you first summarize the data by median life expectancy per year per continent. Then you create box plots - one for each continent.
# summarize the data - median value by content and year
summary_life_exp <-  gap_data %>%
   group_by(continent, year) %>%
   summarise(median_life = median(lifeExp))

ggplot(summary_life_exp, aes(x = year, y = median_life, colour = continent)) +
  geom_point() +
      labs(x = "Year",
           y = "Median Life Expectancy (years)",
          title = "Gapminder Data - Life Expectancy",
          subtitle = "Downloaded from Jenny Bryan's Github Page")
Piping Data to ggplot()
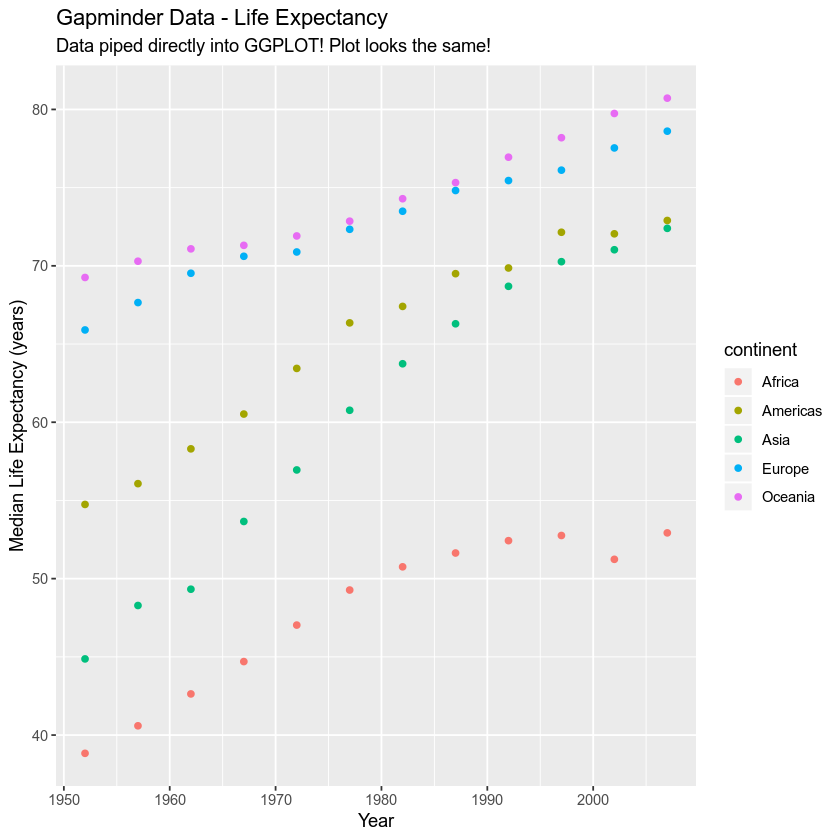
Above, you used dplyr pipes to summarize the data that you wanted to plot. Remember that you can instead send the data directly to the ggplot() function from the pipe. Sending the data directly to the ggplot() function, eliminates creating an intermediate data.frame in your environment.
# summarize the data - median value by content and year
gap_data %>%
   group_by(continent, year) %>%
   summarise(median_life = median(lifeExp)) %>%
   ggplot(aes(x = year, y = median_life, colour = continent)) +
      geom_point() +
      labs(x = "Year",
           y = "Median Life Expectancy (years)",
          title = "Gapminder Data - Life Expectancy",
          subtitle = "Data piped directly into GGPLOT! Plot looks the same!")
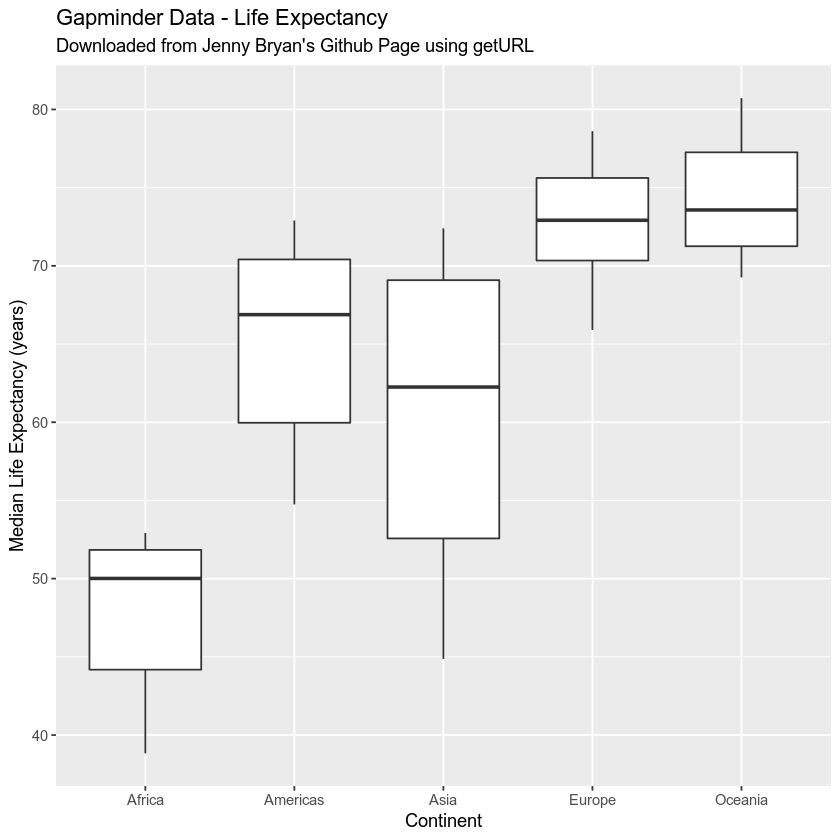
Below, you make a boxplot of lifeExp by continent too. Notice in this case you are using the dplyr output above, again. Thus, it made sense above to save your dplyr output as a new data.frame.
# create box plot
ggplot(summary_life_exp,
       aes(continent, median_life)) +
      geom_boxplot() +
      labs(x = "Continent",
           y = "Median Life Expectancy (years)",
          title = "Gapminder Data - Life Expectancy",
          subtitle = "Downloaded from Jenny Bryan's Github Page using getURL")
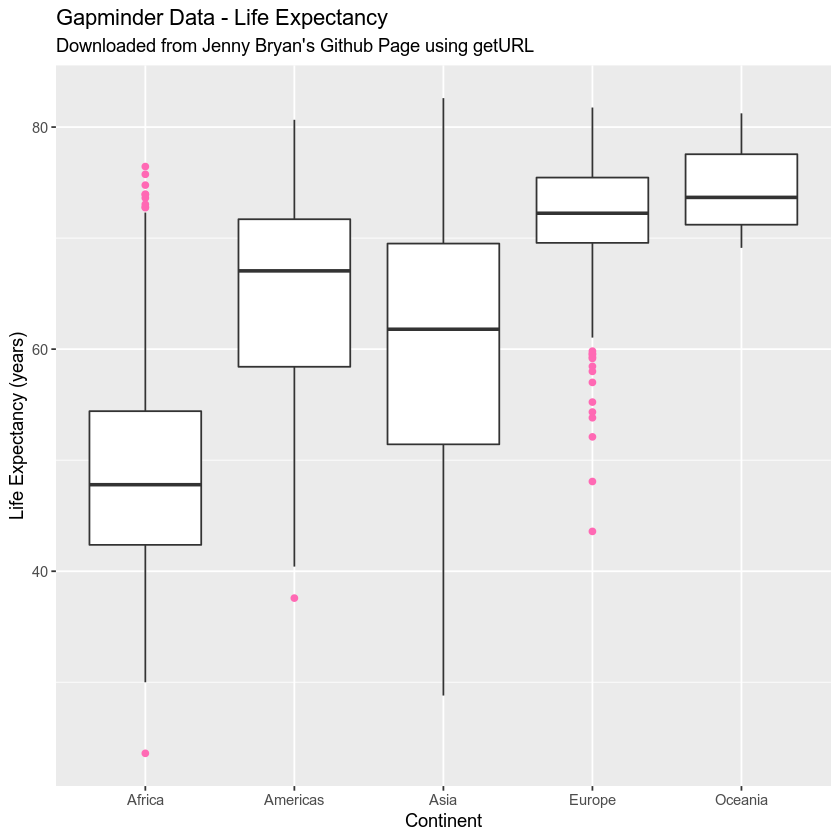
You can also create a more advanced plot - overlaying the data points on top of a box plot. See the ggplot documentation to learn more advanced ggplot() plotting approaches.
ggplot(gap_data, aes(x = continent, y = lifeExp)) +
  geom_boxplot(outlier.colour = "hotpink") +
      labs(x = "Continent",
           y = "Life Expectancy (years)",
           title = "Gapminder Data - Life Expectancy",
           subtitle = "Downloaded from Jenny Bryan's Github Page using getURL")
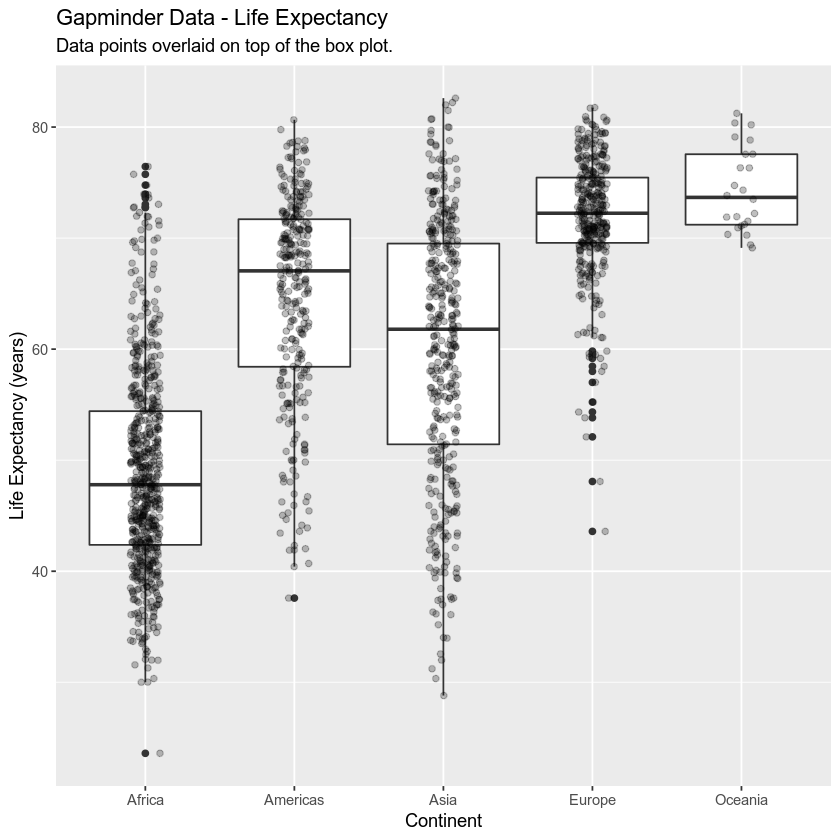
Or create a box plot with the data points overlaid on top.
ggplot(gap_data, aes(x = continent, y = lifeExp)) +
  geom_boxplot() +
  geom_jitter(position = position_jitter(width = 0.1, height = 0), alpha = 0.25) +
      labs(x = "Continent",
           y = "Life Expectancy (years)",
           title = "Gapminder Data - Life Expectancy",
           subtitle = "Data points overlaid on top of the box plot.")
Automation & Secure Url’s
If you are going to grab many .csv files from secure urls, you might need to use functions from the RCurl package. Below you will find a function that uses getURL() and textConnection() to access data from a secure URL. The function takes a URL as in the input and returns a data.frame object in R.
read_secure_csv_file <- function(url, the_sep = ",") {
  url <- getURL(url)
  the_data <- read.csv(textConnection(url),
                       sep = the_sep)
  return(the_data)
}
Data Tip: The web changes constantly! Data available via a particular API at a particular point in time may not be available indefinitely. Consider documenting workflows carefully.
Share on
Twitter Facebook Google+ LinkedIn
Leave a Comment