Lesson 3. Explore Precipitation and Stream Flow Data Using Interactive Plots: The 2013 Colorado Floods
In this classroom activity you will look at different types of data that scientifically quantify / document the drivers (causes of) and impacts of a disturbance event like a flood.
Learning Objectives
At the end of this activity, you will be able to:
- Describe two related drivers of a flood event.
- Interpret plots containing time series data related to flood drivers.
What You Need
You need a computer with internet to complete this lesson.
Exploring Flood Damage
In the previous lesson, you:
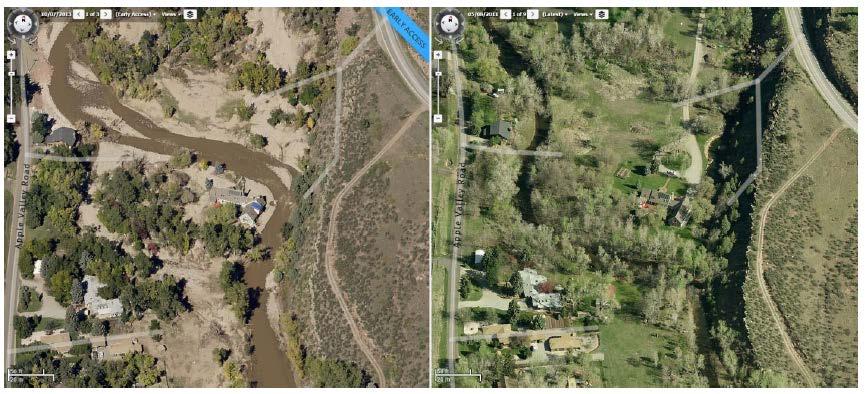
- Looked at visible damage caused by the 2013 floods using Google Earth imagery.
- Explored an extremely well written report on the floods identifying things that may make the report better.
In this lesson you will explore two of the drivers of the flood and associated flood impacts. A driver is a cause of a disturbance events.
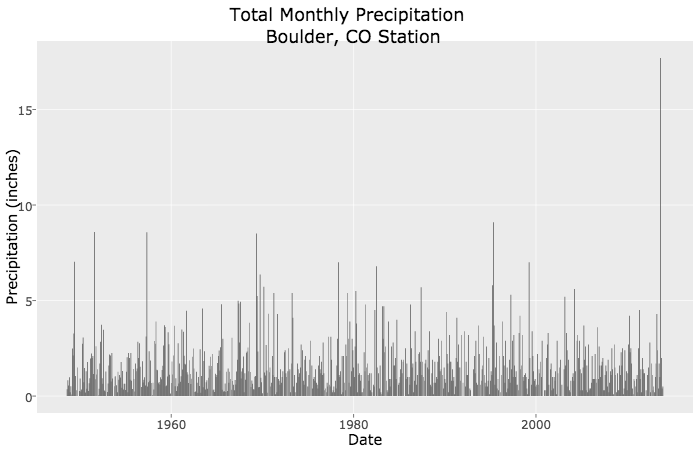
Precipitation
Examine the plots below. Think about what the data may or may not be telling you. Then answer the questions below.
Precipitation: is the moisture that falls from clouds including rain, hail and snow.
Activity: Precip Data
What do the data tell you about precipitation patterns?
As a group, discuss the following questions. Record your answers in the Google doc that your instructor shared with you for today’s class. As you explore the data, keep in mind that the the flood event occured September 2013.
- What patterns do you observe in the data? Note any data points that appear to be visibly different from the other data points in the plots?
- Do you think the differences that you note are statistically significant? Do you have enough information to determine this?
- For each difference: What you think caused that difference?
- For each difference: How can you quantitatively record the differences?
- What other factors may have contributed to the patterns that you observe in precipitation? What other data would you like to see to better “tell the story” of what took place during the flood?
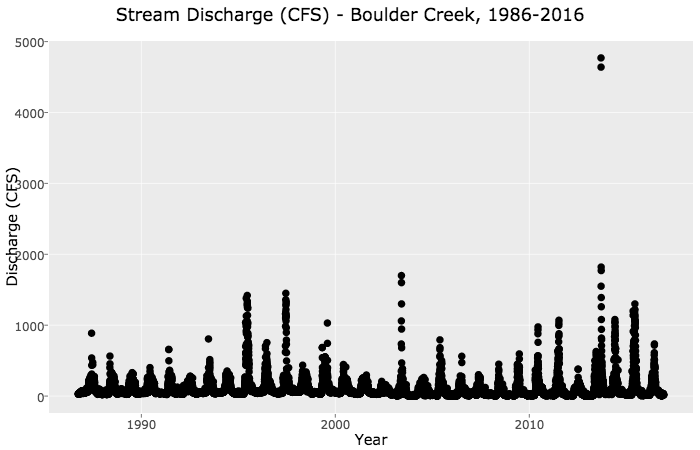
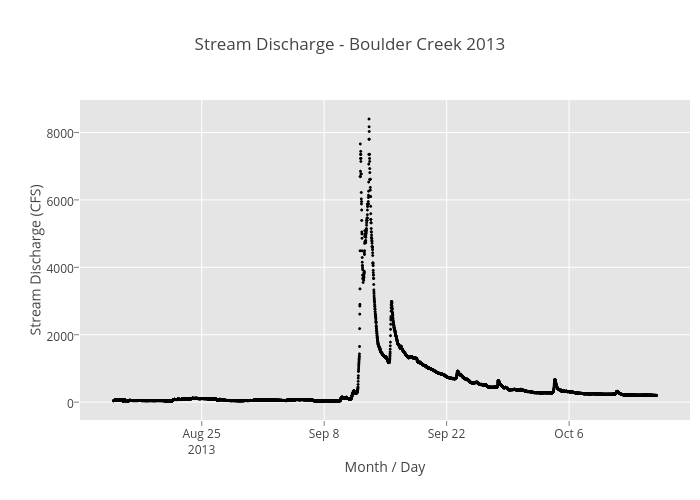
Stream Flow (Discharge)
Stream Discharge, quantifies the volume of water moving down a stream. Discharge is an ideal metric to quantify stream flow, which increases significantly during a flood event.
Activity: Stream Discharge Data
What do the data tell you about stream discharge?
As a group, discuss the following questions. Record your answers in the same Google doc that you used above.
- What differences do you see in stream discharge between 2012 and 2013?
- For each difference: What you think caused that difference?
- For each difference: How can you quantitatively record the differences?
- For each CAUSE listed above, could you somehow quantitatively record the magnitude (size or impact) of the cause?
- Was the cause - caused by (driven by) something else?
Activity: Driver / Impact Diagrams
Finally – Create a diagram that illustrates the drivers and impacts of a flood
Work with your group to create a diagram of the 2013 floods. In this diagram include everything that you think contributed to the flood itself (based on the discussions that we had in class and what you know). When you are happy with your diagram, create a digital version of it (take a picture using a phone, etc). Then, post your diagram to the piazza discussion board under week1. NOTE: look for the post titled “Week 1: driver / impact diagrams”
When everyone has posted - scroll through ALL of the diagrams and “select” the one that you think is best using the good note marker at the bottom of that post.
Share on
Twitter Facebook Google+ LinkedIn
Leave a Comment