Introduction to Pandas Dataframes in Python
Welcome to Week 5!
Welcome to Week 5 of the Earth Analytics Bootcamp course! This week, you will write Python code and use the pandas package to import tabular data (.csv) as a pandas dataframe. You will then learn to summarize and manipulate pandas dataframes.
Learning Objectives
After completing the lessons for Week 5, you will be able to:
- Describe the
pandas dataframedata structure - List key differences between
numpy arraysandpandas dataframes - Write
Pythoncode to import tabular data (.csv) intopandas dataframes - Write
Pythoncode to describe, manipulate, and plotpandas dataframes - Write
Pythoncode to select data frompandas dataframeusing indexing based on locations and values
Homework & Readings
Click here to view the GitHub Repo with the assignment template.
Earth Data Science Textbook Readings
Please read the following chapters of the Intro to Earth Data Science online textbook to support completing this week’s assignment:
Optional: You may also want to review the following chapters if you are new to using Python:
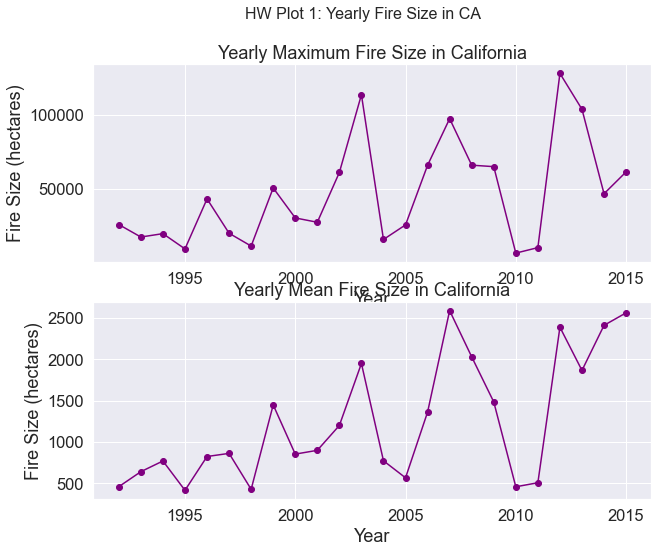
Example Homework Plots
The plots below are examples of what your plot could look like. Feel free to customize or modify plot settings as you see fit!
Share on
Twitter Facebook Google+ LinkedIn