Numpy Arrays
Welcome to Week 6!
Welcome to Week 6 of the Earth Analytics Bootcamp course! This week, you will learn about a commonly used data structure in Python for scientific data: numpy arrays. You will write Python code to import text data (.txt and .csv) as numpy arrays and to manipulate, summarize, and plot data in numpy arrays.
Learning Objectives
After completing the lessons for 6, you will be able to:
- Define a data structure in
Python(e.g. lists,numpy arrays) - Explain the differences between
Pythonlists andnumpy arrays - Write
Pythoncode to import text data (.txt and .csv) intonumpy arrays - Write
Pythoncode to manipulate, summarize, and plot data innumpy arrays
Homework Assignment
Click here to view the GitHub Repo with the assignment template.
Earth Data Science Textbook Readings
Please read the following chapters to support completing this week’s assignment:
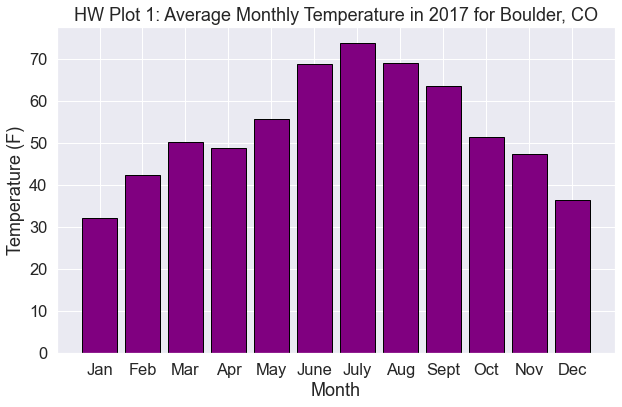
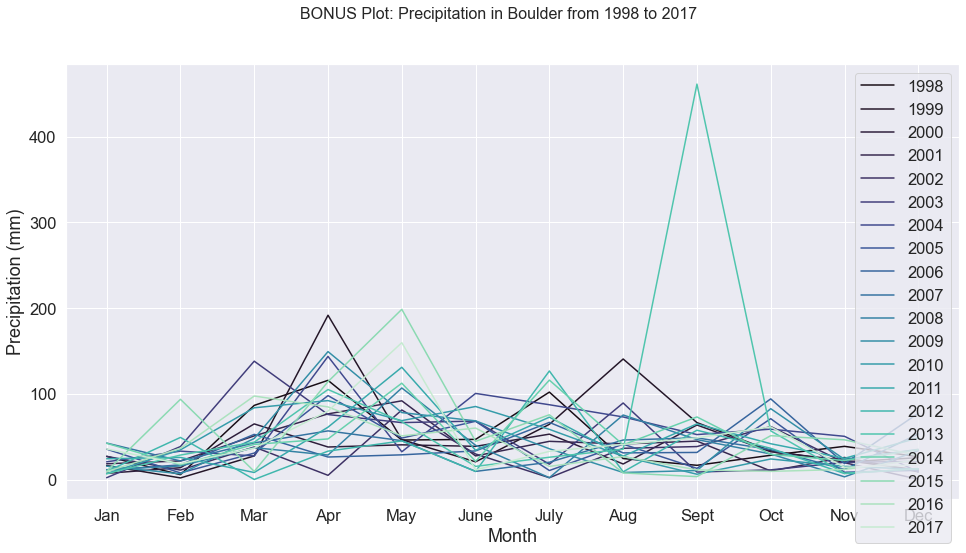
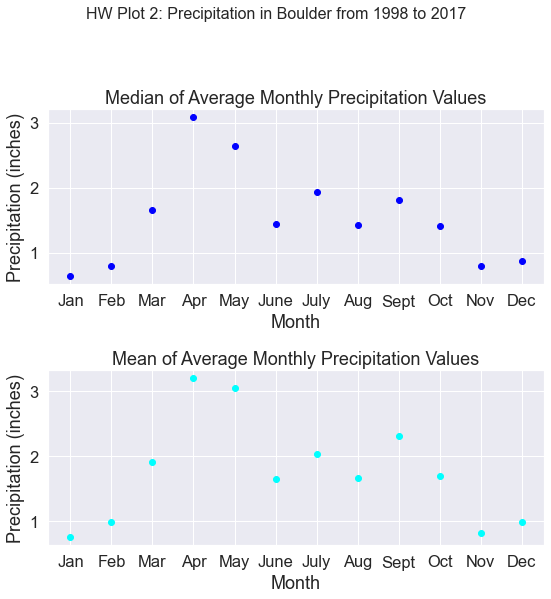
Example Homework Plots
The plots below are examples of what your plot could look like. Feel free to customize or modify plot settings as you see fit!
Share on
Twitter Facebook Google+ LinkedIn