Final Assignment
Welcome to Week 14!
Welcome to the Final Week of the Earth Analytics Bootcamp course! This week, you will practise some of the skills that you learned all semester. You will use API’s to access data and will write functions to process your Python code in Jupyter Notebook.
Learning Objectives
This week you will apply the skills that you’ve learned to a final assignment.
Homework & Readings
Click here to view the GitHub Repo with the assignment template. </i>{: .btn .btn–info .btn–x-large}
Earth Data Science Textbook Readings
Please read the following chapters of the Intermediate to Earth Data Science online textbook to support completing this week’s assignment:
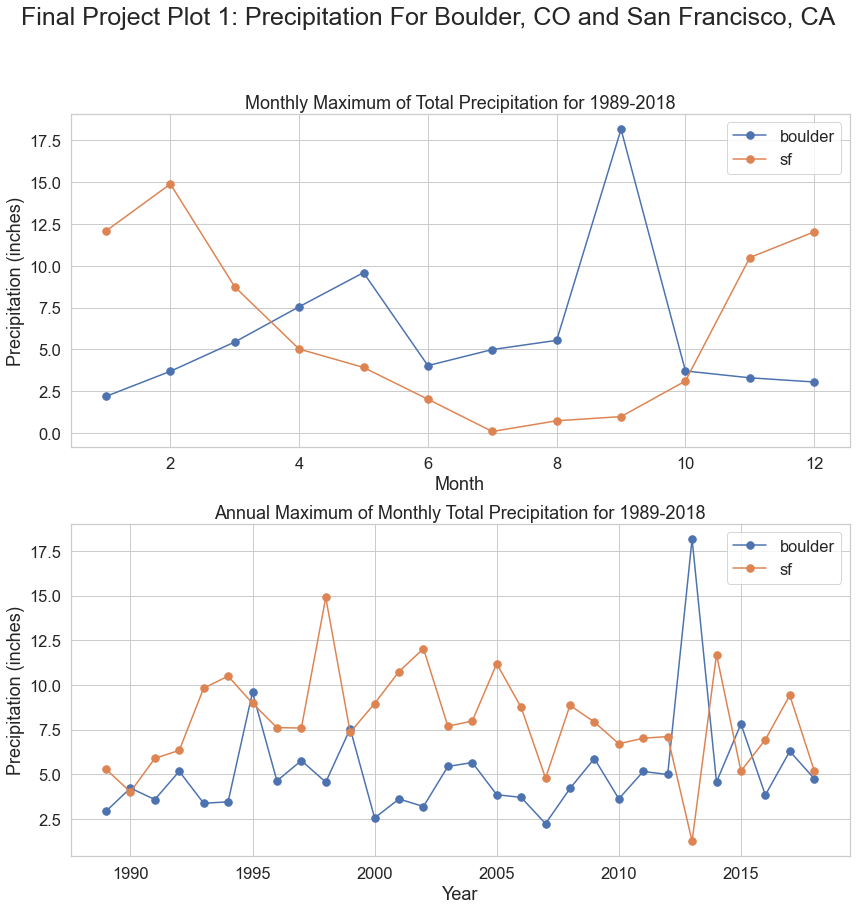
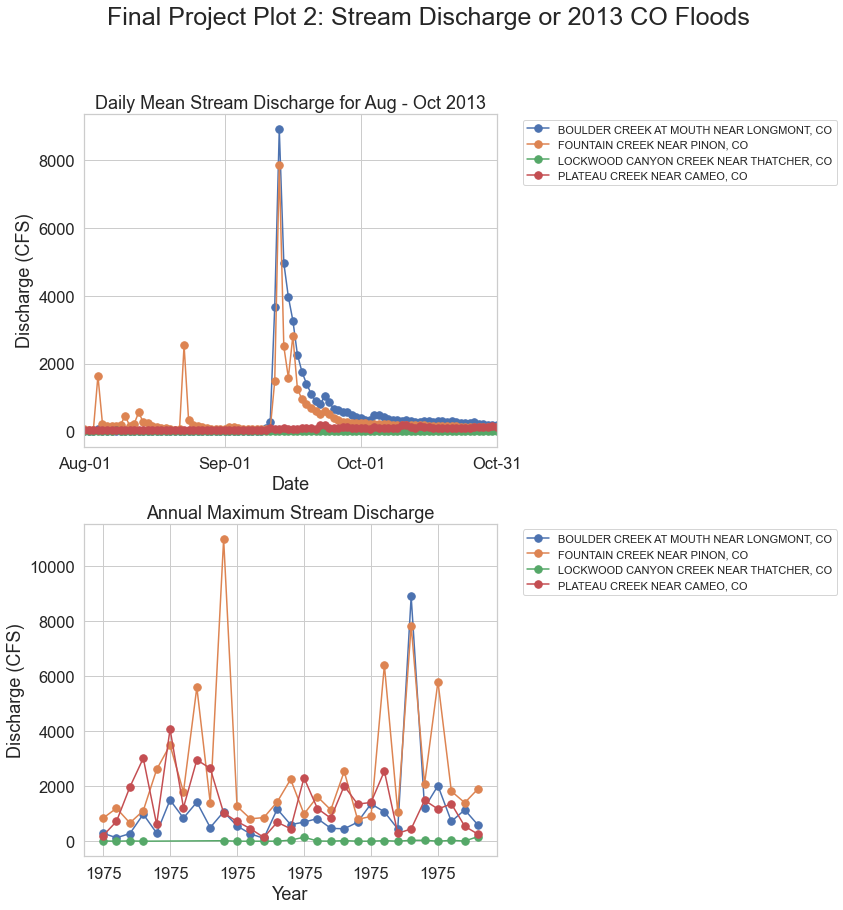
Example Homework Plots
Below are example versions of the plots you will create for your homework.
Downloading from https://ndownloader.figshare.com/files/25564340
Extracted output to /root/earth-analytics/data/earthpy-downloads/boulder-san-fran-precip
Share on
Twitter Facebook Google+ LinkedIn