Lesson 4. Rain: a Driver of the 2013 Colorado Floods
Learning Objectives
- Describe how rainfall or precipitation contributes to a flood event.
- Describe how rainfall is measured.
What Is Precipitation?
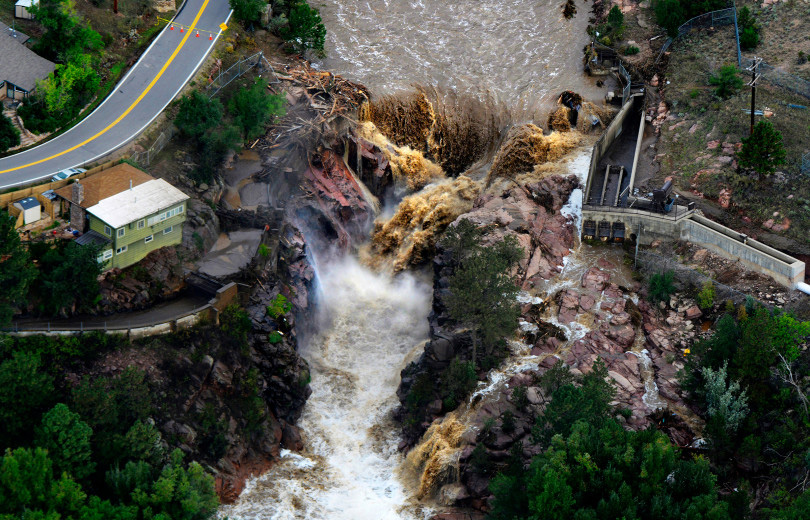
Precipitation refers to moisture from the condensation of atmospheric water vapor that falls to the ground. The term precipitation can refer to rain, snow and even hail. While rainfall is the most common driver of flood events, ice and snow melt can also cause or exacerbate them.
How Is Precipitation Measured?
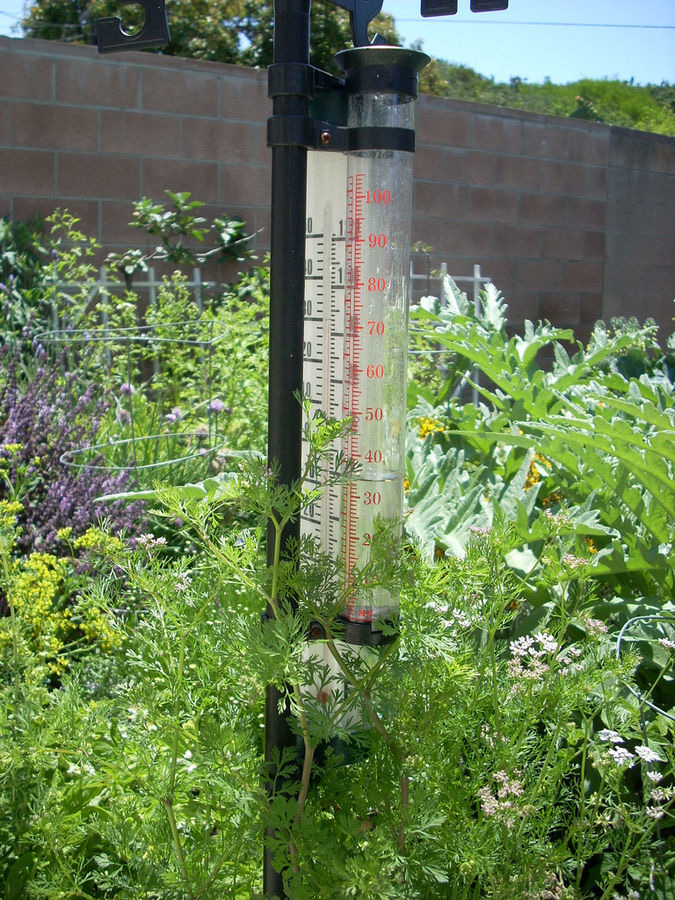
Rainfall is reported as the total amount of rain (millimeters, centimeters, or inches) over a given area per period of time. Various types of gauges can be used to measure precipitation. They are often as simple as a small plastic cylinder with vertical ticks that collects water. These precipitation gauges can be manually checked. In some cases there are automated systems in place that will record precipitation over time.
Where Can You Find Precipitation Data?
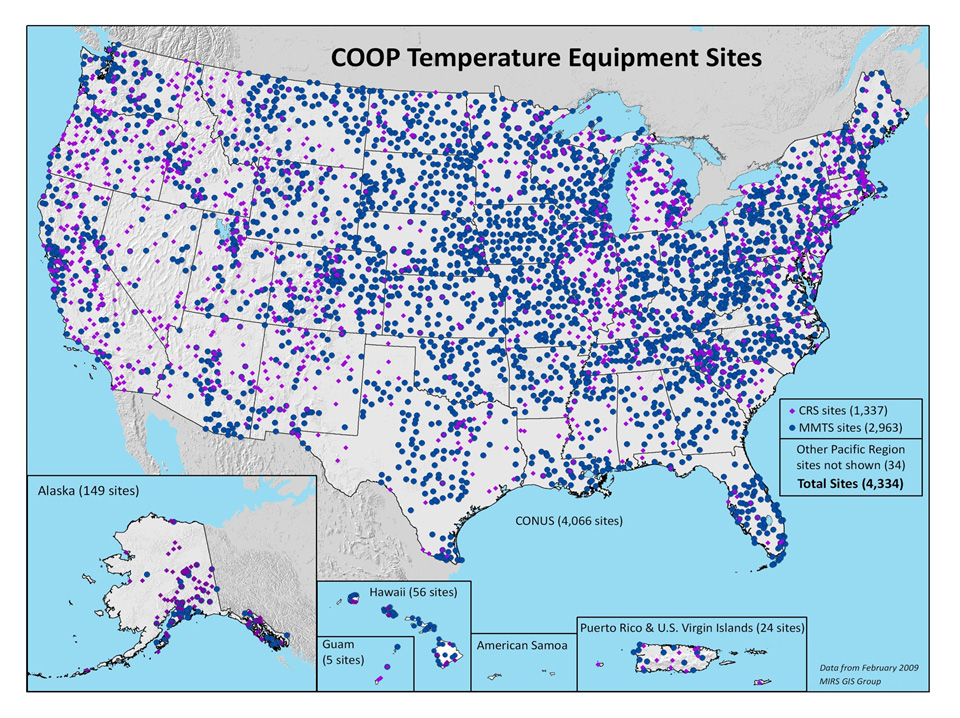
Several US governmental organizations collect precipitation data. In this lesson, you will use data from the National Weather Service (NWS) Cooperative Observer Platform (COOP).
This platform, which is operated by thousands of volunteer weather observers, consists of over 11,000 stations, about 5,000 of them measuring climate. These climate stations report 24 hour minimum and maximum temperature, liquid equivalent precipitation, snowfall, snow depth, and other weather metrics.
Another ‘citizen science’ source of precipitation data is CoCoRaHS. In contrast with COOP, this volunteer network measures only precipitation.
Precipitation and the Colorado Floods
The average annual precipitation (which includes rain and snow) in Boulder, Colorado is 20 inches. This precipitation comes from winter snow, intense summer thunderstorms, and intermittent storms throughout the year.
The precipitation that led to the 2013 floods was a late summer storm. Due to the atmospheric conditions, the storm produced significant precipitation in a short period of time.
How Much Rain Did Boulder Get During the Floods?
The figure below shows the total precipitation each month from 1948 to 2013 for a National Weather Service COOP site located in Boulder, CO.
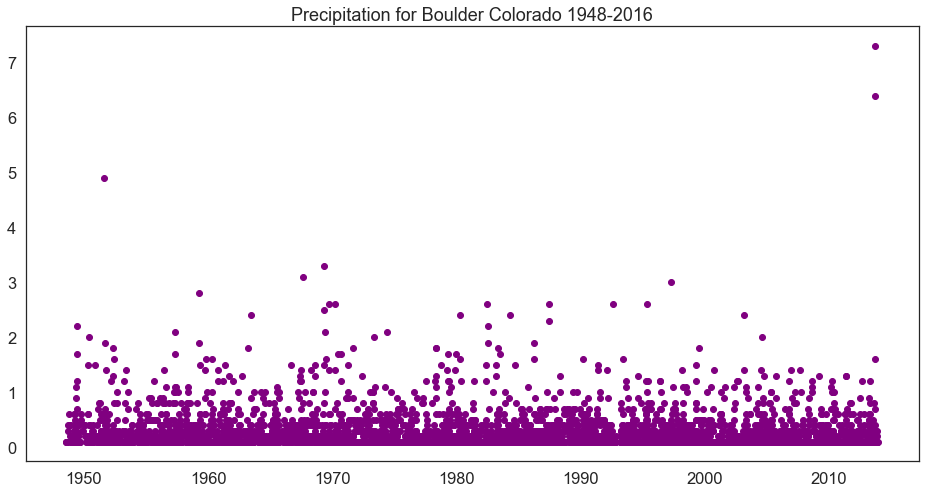
ABOVE: Graph of total monthly precipitation from 1948 to 2013 for the National Weather Service’s COOP site Boulder 2 (Station ID:050843).
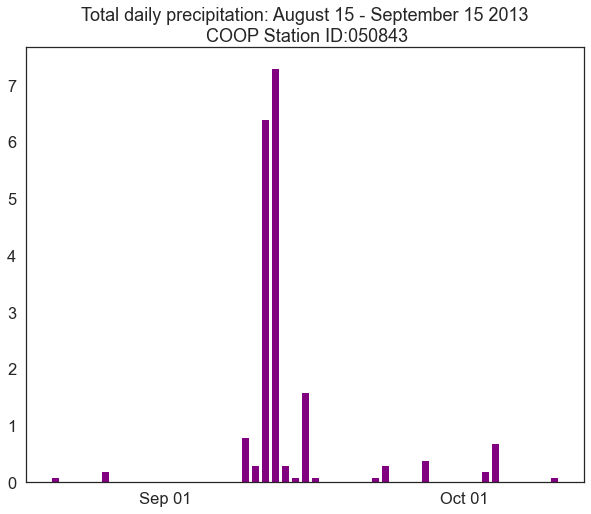
Within this 65 years of data, you can see that there is a jump in the amount of precipitation that was measured in September 2013. If you “zoom in” on the time period of fall 2013 (see the plot below) you will see the precipitation that led to the floods came in the span of just a few days.
Stream Discharge
What Is Stream Discharge?
Stream discharge, or flow, is the volume of water that moves through a designated point over a fixed period of time. Measuring stream discharge helps scientists understand the amount and velocity of water that is moving through an area, which is of particular interest during floods.
How Is Stream Discharge Measured?
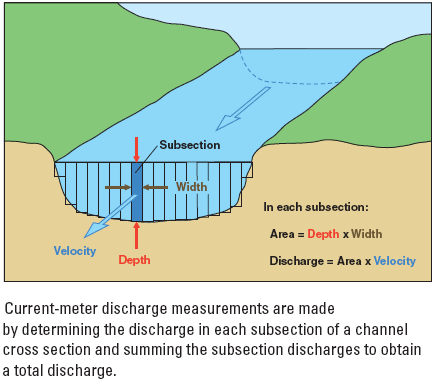
Stream discharge is calculated by multiplying the area of a cross section of the stream by the velocity.
Where Can You Find Stream Discharge Data?
One of the most common sources of stream data is the USGS which maintains a network of sensors in rivers and streams across the country. In addition to stream discharge, these sensors monitor other variables that are important to stream morphology and health such as water level, velocity, and direction of flow.
Stream Discharge and the Colorado Floods
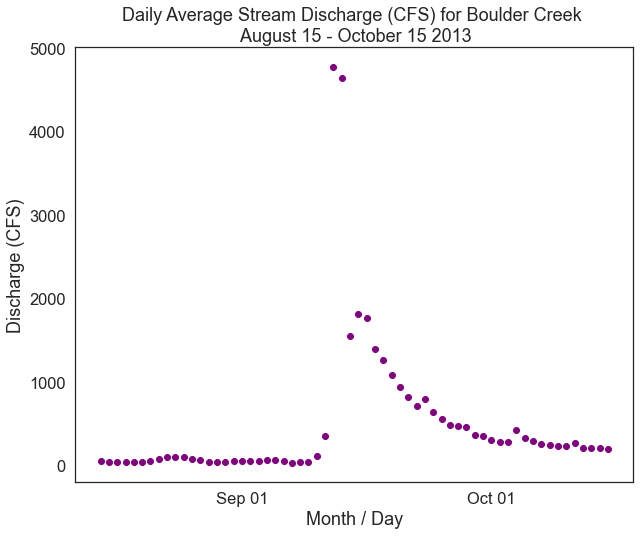
During the flooding in Boulder, the combination of atmospheric conditions, precipitation and drought yielded rapid increases in stream flow, which served as a secondary driver of the floods. Stream discharge in Boulder Creek during the 2013 floods was 100 times greater than average, causing the creek to overflow its banks. The velocity of the water in the streams allowed it to pick up and move significant debris
The daily average data for the stream gauge along Boulder Creek, five miles downstream of downtown Boulder, is graphed below. This graph, paired with the graph of precipitation in the above section, shows that heavy precipitation led to a stream surge. As a result of this extreme discharge rate, water poured into the flood zone.
Share on
Twitter Facebook Google+ LinkedIn
Leave a Comment