Lesson 1. How Do You Design and Automate a Data Workflow
How To Design and Automate a Workflow - Intermediate earth data science textbook course module
Welcome to the first lesson in the How To Design and Automate a Workflow module. Designing and developing data workflows can help you complete your work more efficiently by allowing you to repeat and automate data tasks. Learn how to design and develop automated workflows using the example of calculating a NDVI time series in Python.Chapter Twelve - Intro to Designing and Automating Data Workflows in Python
In this chapter, you will learn how to identify key steps in designing a data workflow and how to write pseudo code to outline data workflow.
Learning Objectives
After completing this chapter, you will be able to:
- List the key steps in designing data workflows.
- Approach a coding task with a modular, systematic approach.
- Write pseudocode for a data workflow.
- Identify aspects of a workflow that can be modularized (i.e. ideal for functions) and tested.
What You Need
You will need a computer with internet access to complete this chapter and a dataset of Landsat scenes across several years and sites.
Download Landsat Automation Data (~600 MB)
Or use earthpy et.data.get_data('ndvi-automation')
Designing workflows to process and create outputs for many large files and datasets is a key skill in Earth Data Science. Yet it is something that most scientists and earth analysts learn on the fly at some point in their careers.
The outline below identifies several key steps associated with designing a workflow that can help you structure your thinking and develop an effective design.
1. Identify the Problem, Challenge or Question
To begin you need to clarify the question(s) or challenge(s) that you need to address. Knowing the specific problem that you need to solve will help to set bounds on what your workflow does and does not need to do.
In this chapter, we will use the example of calculating a time series of normalized difference vegetation index (NDVI) to investigate ecological processes and changes.
What is a Normalized Difference Vegetation Index (NDVI) Time Series?
Previously in this textbook, you have have used vegetation indices to study changes due to a disturbance such as a flood or a fire. Specifically, you used NDVI to identify where vegetation (i.e. greeness) increased or decreased after the disturbance event.
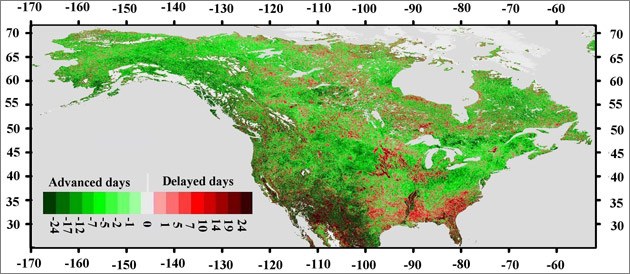
NDVI can also be used to understand seasonality - when an area begins to “green-up” or grow after the winter cold period and “brown down” when vegetation in an area begins to die back or senesce in an area (usually in the fall and winter). You can calculate NDVI for each month of the year (or even for several years) to understand seasonality in a particular study area.
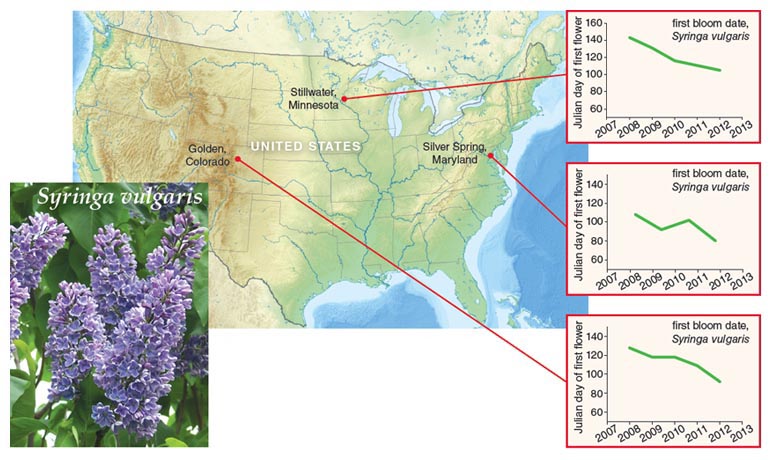
Different areas in different parts of the world have different seasonal patterns. For example, the NEON San Joaquin Experimental Range (SJER) in California has an early green-up date on average, a short growing season due to hot temperatures and lack of precipitation and an early brown down. In contrast, the NEON Harvard Forest (HARV) site in Massachusetts has a longer growing season and a later green-up period.
These two sites are ideal for comparisons of NDVI to identify differences in seasonality across sites and will be used as the study areas for the data workflow challenge.
Why are Changes in Seasonality and Changes in Climate Important?
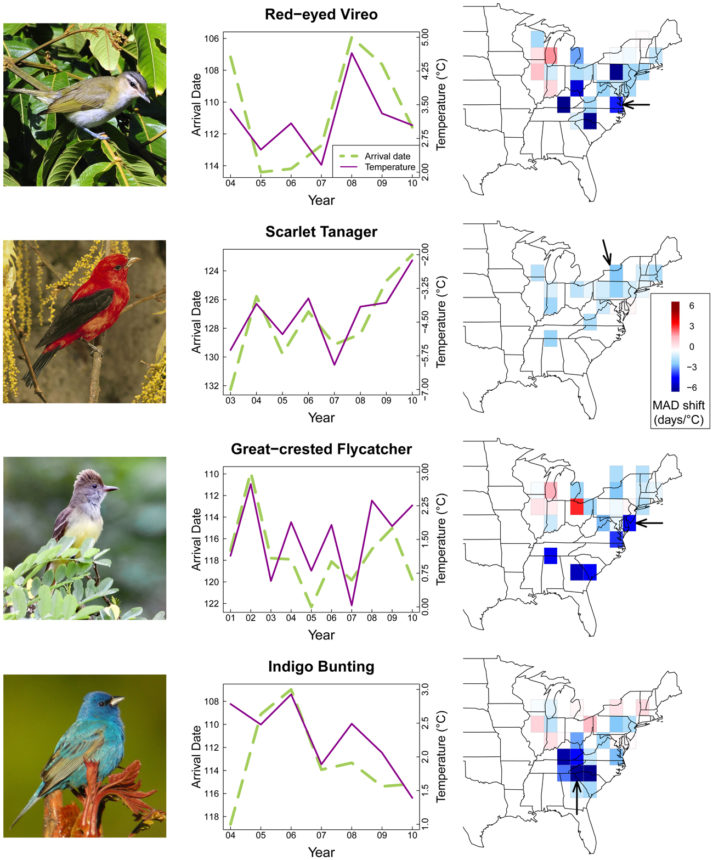
Changes in seasonality can be important indicators of ecological change. For example, if green-up begins earlier, such that fruit or seed resources become available sooner than average, animals that forage on the fruits in the spring must either migrate earlier to use these resources, or miss out on them if they do not adjust migration behavior. This phenomenon is referred to as a phenological mismatch.
2. Identify the Data Needed to Address the Question or Challenge
Once you have a question in mind, it is time to figure out your data requirements. Requirements are the qualities that your data need to have in order to address a particular question well.
For our challenge of calculating a NDVI time series, the goal is to create a time series of NDVI for a study area across a year.
As you want to explore seasonal patterns of “green-up” and “brown down”, you need data that is at least collected each month.
What data do you select for your analysis? Consider temporal frequency of data collection and spatial resolution.
For example, NAIP is collected every other year, so it is unlikely to provide good information on seasonality.
In contrast, MODIS and Landsat may be more useful, because they are collected on daily and bi-monthly frequencies, respectively.
In terms of resolution, MODIS pixels could be too large depending on the size of your study site. Perhaps Landsat has an ideal combination of temporal frequency, resolution and spatial coverage.
3. Design Your Workflow
Next it is time to design the workflow to create the output(s) that will address your question or challenge.
To use the NDVI time series to understand seasonality, it can be helpful to create a plot that shows the NDVI values for each month for a site. In addition, you may want to produce some output files (e.g. CSV files) that you can share with others who may be interested in creating their own visualizations.
For the NDVI time series challenge, you will design a workflow that has two outputs:
- A plot of average NDVI (for each Landsat image) for 2 sites over a year.
- A CSV file containing the average NDVI values (for each Landsat image) for both sites.
Once you know your outputs, you can work backwards to determine the data and steps needed to create your final output(s).
The design process can feel difficult, so it can be helpful to begin the design of the workflow using words (not code), a process known as pseudocoding. With pseudocode, you list out the inputs and outputs of the workflows and then identify the analytical steps needed to create the outputs from the inputs.
The next lesson in this chapter walks you through the pseudocoding process, so that you can use this method to easily design data workflows and more toward automating these workflows.
4. Implement Your Workflow
Once you have designed your workflow (using pseudocode first!), it is time to implement. This is where you can put all of your programming skills to the test.
Try to write code that is clear, efficient, well documented and expressive. Remember that you never know when you may have to re-run or re-use an analysis, and you never know when someone else might need to use your code, too.
Thus, your aim should be to write code that is readable, reproducible, and efficient. Be sure to:
- Use clear, expressive names for objects, files, etc. Ask yourself if someone reading your code could guess what is contained in that object or file based on the name.
- Use reproducible paths for input data and writing outputs (e.g. use
os.path.join()to define paths, include code to create needed directories, etc). - Writing custom functions for repetitive tasks in your workflows.
- Including checks (i.e. tests) in your code to ensure that it is doing what you think is!
These topics will be reviewed more later in this chapter.
Share on
Twitter Facebook Google+ LinkedIn
Leave a Comment