Lesson 1. An Overview of the 2013 Colorado Floods
An Overview of the 2013 Floods in Colorado, USA - Intermediate earth data science textbook course module
Welcome to the first lesson in the An Overview of the 2013 Floods in Colorado, USA module. In this module you will learn about the causes and effects of floods as seen during the 2013 Colorado floods. You will learn how streamflow, precipitation, drought, and remote sensing data are used to better understand flooding.Chapter 20 - The 2013 Colorado Floods
In this chapter, you will learn about the 2013 floods in Colorado and describe the events and conditions leading up to the floods.
Learning Objectives
After completing this chapter, you will be able to:
- Describe the events that lead up to the 2013 Colorado Floods.
- Describe how atmospheric conditions contribute to flood events.
- Describe one method that is used to study and track atmospheric conditions.
About The 2013 Colorado Flood
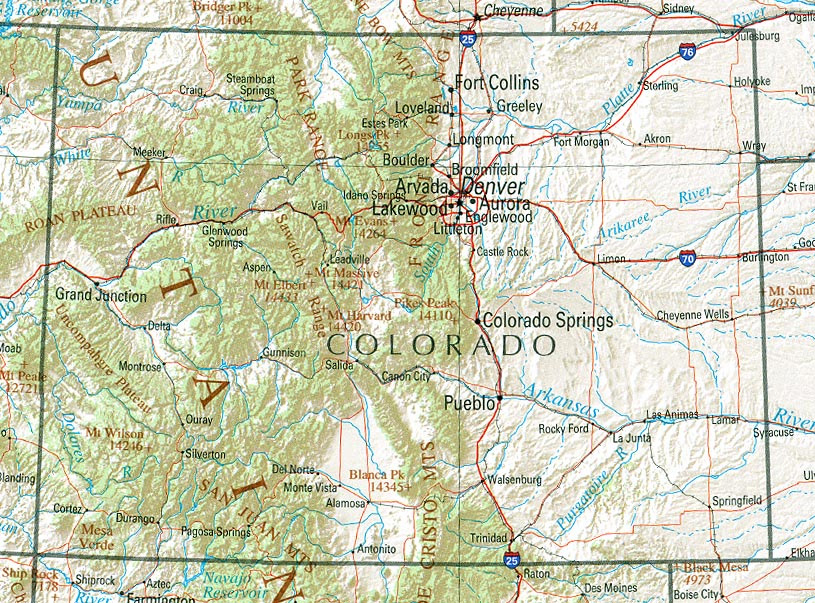
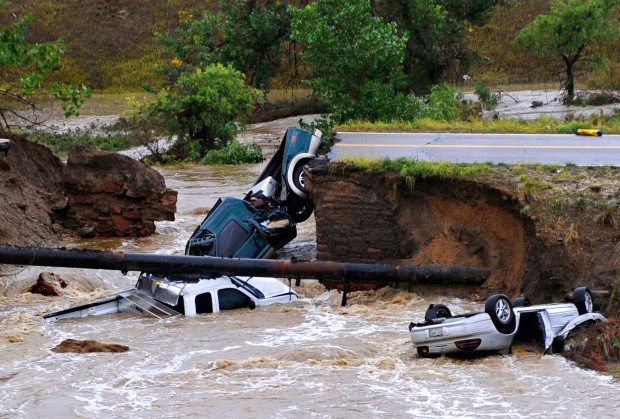
In early September 2013, a slow moving cold front moved through Colorado intersecting with a warm, humid front. The clash between the cold and warm fronts yielded heavy rain and devastating flooding across the Front Range of Colorado. Boulder County, Colorado, located where the Rocky Mountains meet the high plains, was impacted by this flood event.

What Is a Flood?
A flood is when water inundates normally dry land. Scientists (ecologists) often refer to floods as disturbance events. A disturbance event is a temporary change in environmental conditions that causes a large change to an ecosystem. Fires, earthquakes, tsunamis, air pollution, and human development are all examples of disturbance events. While floods and other disturbance events can happen in the span of a few minutes or days, their ecological impacts can last for decades or even longer. Other scientists may refer to floods as extreme events or even hazards.

A History of Floods in Colorado

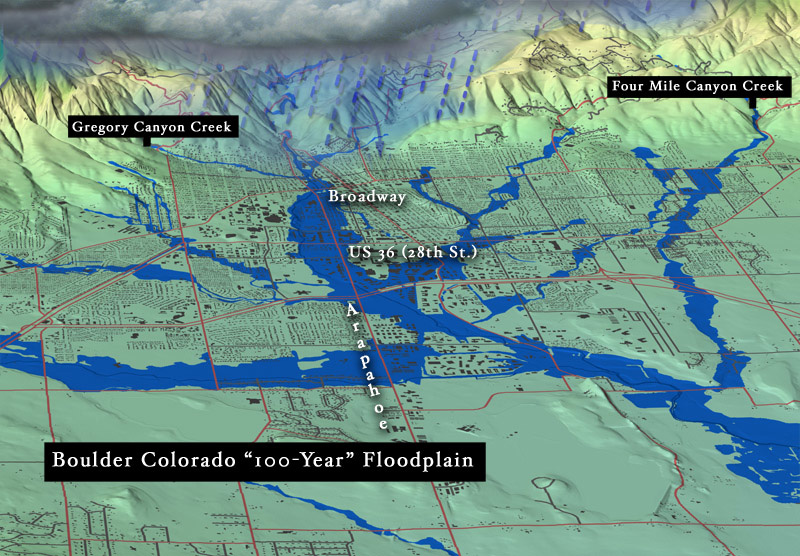
Boulder County, and Colorado in general, are susceptible to both flash floods and river floods. Flash floods, like the 2013 Colorado floods, are sudden and intense increases in streamflow, usually due to extreme weather. River floods occur more slowly and are more predictable. The 2013 floods are classified as a “100 year flood.” This means that a flood of their magnitude has a 1% chance of occurring each year. The first major flood reported in Boulder occurred in 1894 and was also a 100 year flood. Boulder’s first non-native settlers came in 1858, so many unreported floods likely occurred prior to that one.

Boulder County’s landscape makes it prone to flooding. The nearby mountains create steep slopes and canyons which act as chutes ejecting water into the downstream plains. These mountains also create atmospheric conditions that lend to frequent isolated storms. In addition, the Front Range of Colorado is susceptible to wildfires and drought. These disturbance events make soil less able to absorb water, which both increases the likelihood of and exacerbates flooding.
How Do You Measure Flood Events and Impacts?
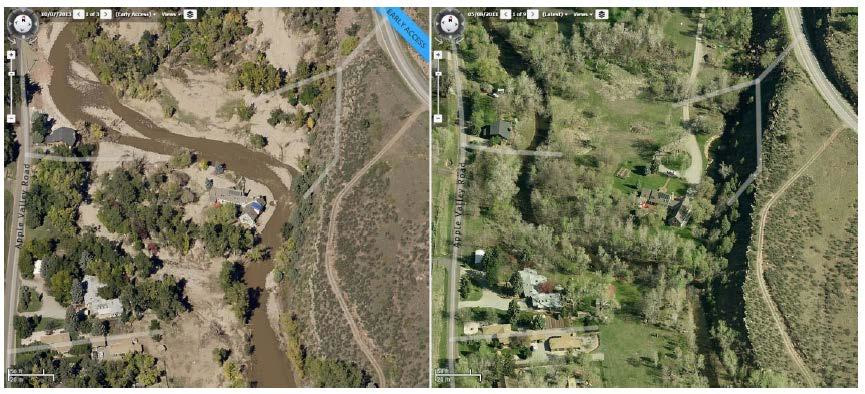
You can measure causes and effects of floods with a variety of data types including precipitation data, drought indices, stream discharge data, lidar terrain data and other remotely sensed imagery that shows areas that have visually changed due to erosion, mudslides and other impacts.
| Data Type | Potential Data Source |
|---|---|
| Atmospheric Conditions | National Oceanic and Atmospheric Association (NOAA) GOES Satellite Data |
| Drought | National Drought Mitigation Center Drought Monitor |
| Precipitation | National Weather Service COOP data |
| Stream Discharge | United States Geological Survey (USGS) Surface Water Data |
| Lidar Terrain Data | USGS Lidar Data |
| Other remotely sensed imagery | USGS Landsat Data, European Space Agency Sentinel-2 Data, United States Department of Agriculture (USDA) NAIP Data |
In the following sections you will learn more about each of the drivers and impacts of the floods and the data used to quantify these drivers and impacts. You will then learn how to work with different types of data in Python to better understand flood events including:
- Stream discharge data
- Precipitation data
- Lidar data
Share on
Twitter Facebook Google+ LinkedIn
Leave a Comment