Lesson 5. Measure Changes in the Terrain Caused by a Flood Using Lidar Data
Learning Objectives
- Describe how lidar data are used to measure changes in the landscape after a flood.
Measuring Impacts of the 2013 Colorado Floods
The Colorado floods had significant environmental, social and economic impacts. Now that you have a better understanding of the flood’s drivers and how to measure them—including atmosphere and drought as well as precipitation and stream discharge—you will learn how to use remote sensing to measure the impacts of flood events on the landscape.
Aerial imagery video of Lee Hill, near Boulder, CO, before and after the 2013 flood event. Source: NEON Science.
Last week you used Google Earth before and after imagery to view differences in the landscape in Boulder prior to and following the flood. In that exercise, you were able to see areas where roads and buildings were lost, where mudslides occurred, and more.
In the following weeks, you will use Light Detection and Ranging (lidar) data to understand changes in terrain that occur during a flood. LiDAR data can be used to measure changes in elevation over time.

How Floods Impact the Landscape
What Is Lidar Data?
Watch the video below to learn more about how lidar data works.
How Do You Use Lidar to Measure Flood Impacts on Landscapes?
Sedimentation and erosion are common landscape impacts from flooding. These processes occur when heavy rain leads to increased streamflow, which leads to stream surges, which creates energy that erodes sediment from one place and moves it to another. Lidar sensors on satellites and airplanes scan the landscape and create models of the elevation of the earth’s surface.
Lidar data collected before and after a flood event can be used to quantify sedimentation and erosion due to the flood. Lidar can also be used to quantify the loss or movement of trees, buildings, and other objects that are on the earth’s surface.
Lidar data are often converted into raster format because it is easier to work with. A Digital Elevation Model (DEM) is a common lidar derived raster product. DEMs can be Digital Terrain Models (DTM), which measure only the elevation of the ground (terrain), or Digital Surface Models (DSM) which measure the elevation of everything on the surface of the earth, including trees, buildings, or other structures.
Below you will use lidar data to create DEMs to analyze landscape change due to the Colorado floods.
Where Can You Find Lidar Data?
Several public organizations offer free lidar data including:
The data that you will use this week in the course was collected by NEON.
Using Elevation Models to Track Flood Impacts
Use Digital Terrain Models to Track Changes in Terrain
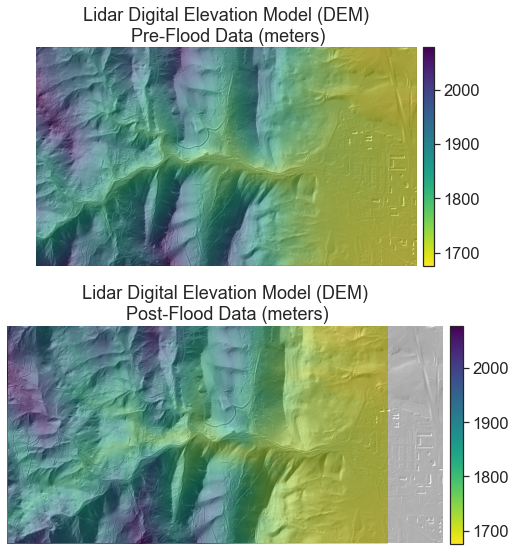
Below, you can see a Digital Terrain Model (DTM) created for the lower Four-Mile Canyon Creek area in Boulder, Colorado using data collected before and after the 2013 floods. These maps show subtle differences in elevation, particularly along the stream bed. However, it is challenging to really compare these maps with the naked eye.
Digital Elevation Model of Difference (DoD)
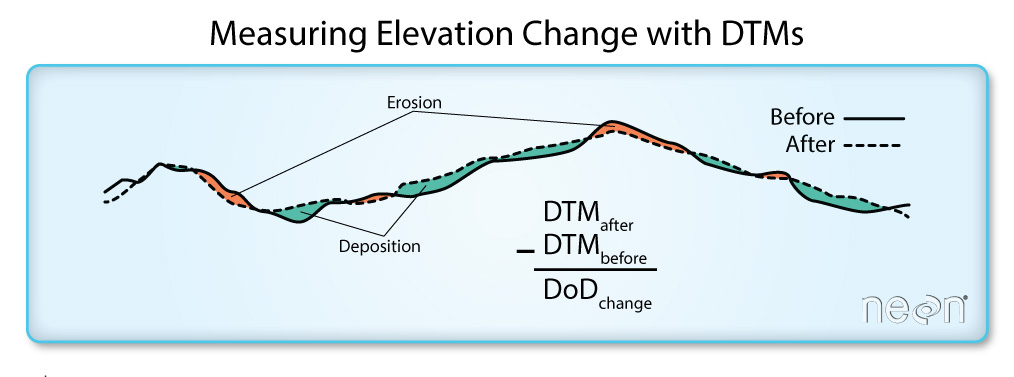
While the above DEMs look almost identical visually, they can be used to create another model that is more useful for the purpose of studying flood impacts, a Digital Elevation Model of Difference (DoD). A DoD is created by subtracting one DTM from the other and shows the change that occurred in a given location over a certain period of time.
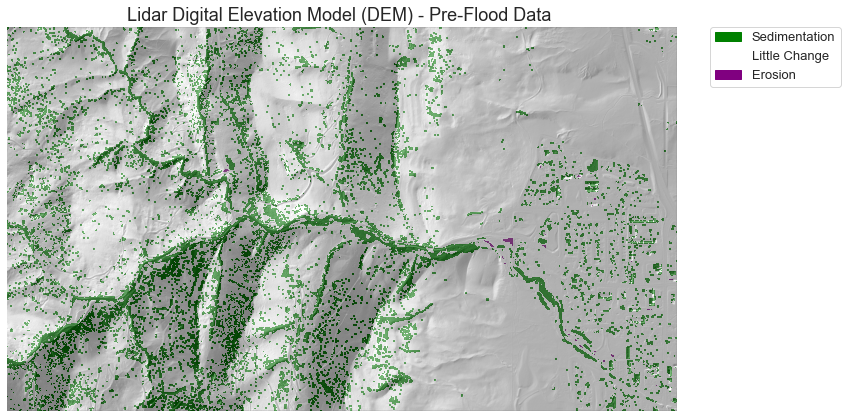
The DoD created with the Four Mile Canyon Creek DTMs is below. Areas in purple have a lower elevation after the flood; in other words, they have experienced erosion. Areas in green have a higher elevation after the flood and have experienced sedimentation.
Below is a cross-section showing the data represented by a DoD. The orange areas are where the earth’s surface is lower than before and the teal areas are where the earth’s surface is higher than before.
Using Data to Study Floods and other Extreme Events
Now you should have a better understanding of how data on drought, atmospheric conditions, precipitation, streamflow, and elevation can help you understand floods. Quantifying drivers and impacts with these tools allows scientists, city planners, developers, and homeowners to make educated choices to prepare for and respond to disturbance events. In the next lessons you will learn how to use Python to work with lidar data to understand landscape change.
Share on
Twitter Facebook Google+ LinkedIn
Leave a Comment