Lesson 3. About the Stream Discharge Data Used in this Data Story
Learning Objectives
- Be able to describe where the stream discharge data that is provided in this data story comes from and what it represents.
About the Data - USGS Stream Discharge Data
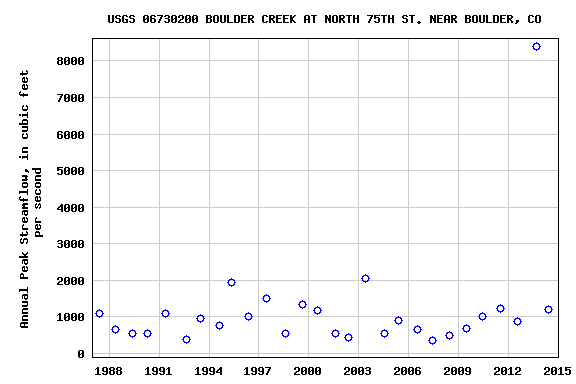
The USGS has a distributed network of aquatic sensors located in streams across the United States. This network monitors a suit of variables that are important to stream morphology and health. One of the metrics that this sensor network monitors is Stream Discharge, a metric which quantifies the volume of water moving down a stream. Discharge is an ideal metric to quantify flow, which increases significantly during a flood event.
As defined by USGS: Discharge is the volume of water moving down a stream or river per unit of time, commonly expressed in cubic feet per second or gallons per day. In general, river discharge is computed by multiplying the area of water in a channel cross section by the average velocity of the water in that cross section.
Data Tip: To make your plots more attractive check out this tutorial from seaborn!
Share on
Twitter Facebook Google+ LinkedIn
Leave a Comment