Lidar Remote Sensing Uncertainty - Compare Ground to Lidar Measurements of Tree Height in Python
Welcome to Week 4!
Welcome to week 4 of Earth Analytics! This week, you will explore the concept of uncertainty surrounding lidar raster data (and remote sensing data in general). You will use the same data that you downloaded last week for class.
For your homework you’ll also need to download the data below. You can do this most easily using earthpy.get_data().
Download Spatial Lidar Teaching Data Subset data
or using the earthpy package: et.data.get_data("spatial-vector-lidar")
Homework
The Homework Assignment for This Week Can Be Found on Github
Click here to view the GitHub Repo with the assignment template.
The lessons for this week have been moved to our Intermediate Earth Analytics Textbook.
Earth Analytics Textbook Chapters
Please read the following chapters to support completing this week’s assignment:
- NEW: Raster / Vector Spatial Data Applications: Compare Lidar to Human Measured Tree Heights – Uncertainty
- REVIEW: Intro to Vector Spatial Data in Open Source Python
1. Readings
- Influence of Vegetation Structure on Lidar-derived Canopy Height and Fractional Cover in Forested Riparian Buffers During Leaf-Off and Leaf-On Conditions
- The characterization and measurement of land cover change through remote sensing: problems in operational applications?
- Learn more about the various uncertainty terms.
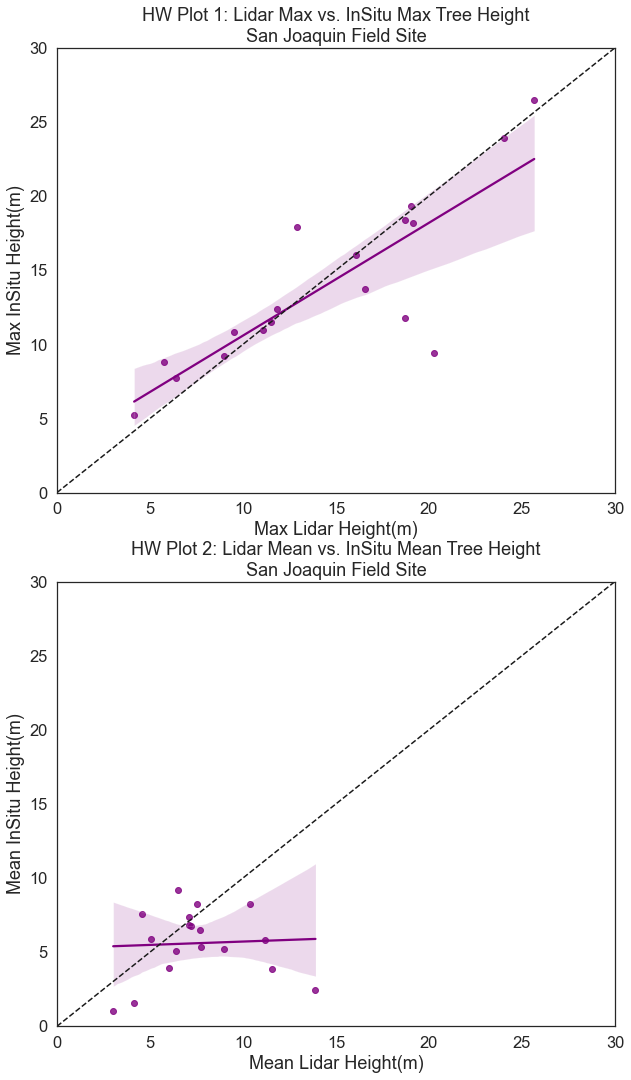
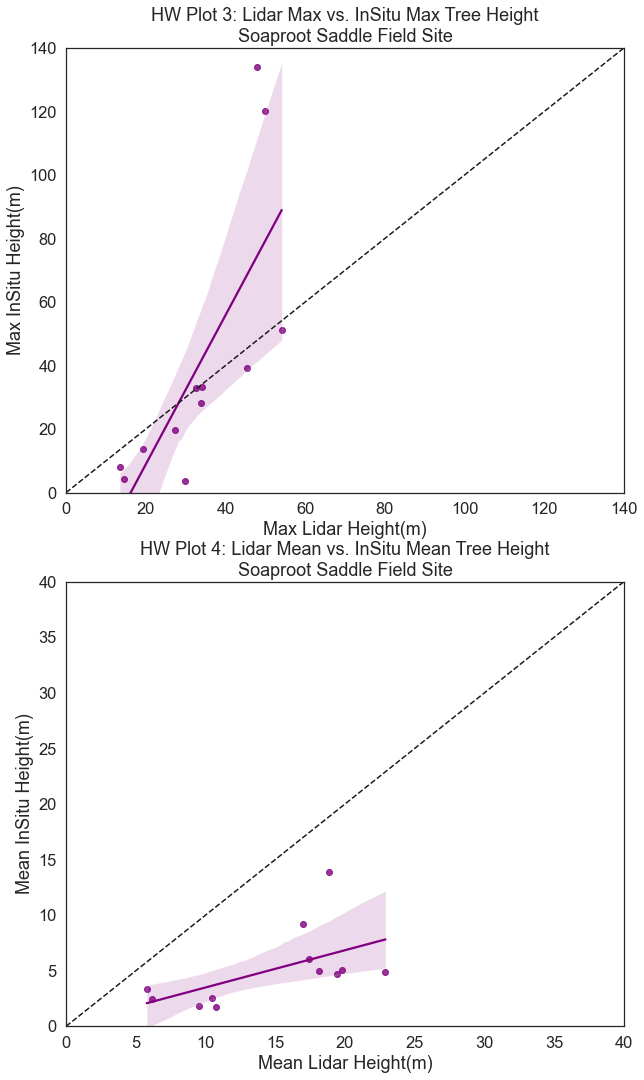
Example Homework Plots
The plots below are examples of what your plot could look like. Feel free to customize or modify plot settings as you see fit!
Share on
Twitter Facebook Google+ LinkedIn