Quantify the Impacts of a Fire Using MODIS and Landsat Remote Sensing Data in Python
Welcome to Week 9!
Welcome to week 9 of Earth Analytics! This week you will work with MODIS and Landsat data to calculate burn indices.
Download Cold Springs Fire Data (~150 MB)
Or use earthpy et.data.get_data('cold-springs-fire')
Materials to Review For This Week’s Assignment
Please be sure to review:
- Chapter 11 on Calculating Normalized Burn Ratio (NBR) in Section 5 of the Intermediate Earth Data Science Textbook and
- Data Story on Cold Springs Fire in Section 7 of the Intermediate Earth Data Science Textbook
1. Complete the Assignment Using the Template for this week.
Note that this assignment is worth more points than a usual weekly assignment.
Click here to view the the example GitHub Repo with the assignment template.
2. Suggested Fire Readings
Please read the articles below to prepare for next week’s class.
- Denver Post article on the Cold Springs fire.
- Fire science for rainforests - Cochrane 2003.
- A review of ways to use remote sensing to assess fire and post-fire effects - Lentile et al 2006.
- Comparison of dNBR vs RdNBR accuracy / introduction to fire indices - Soverel et al 2010.
Downloading from https://ndownloader.figshare.com/files/10960211?private_link=18f892d9f3645344b2fe
Extracted output to /root/earth-analytics/data/cs-test-naip/.
Downloading from https://ndownloader.figshare.com/files/10960109
Extracted output to /root/earth-analytics/data/cold-springs-fire/.
Downloading from https://ndownloader.figshare.com/files/10960112
Extracted output to /root/earth-analytics/data/cold-springs-modis-h4/.
Downloading from https://ndownloader.figshare.com/files/21941085
Extracted output to /root/earth-analytics/data/earthpy-downloads/landsat-coldsprings-hw
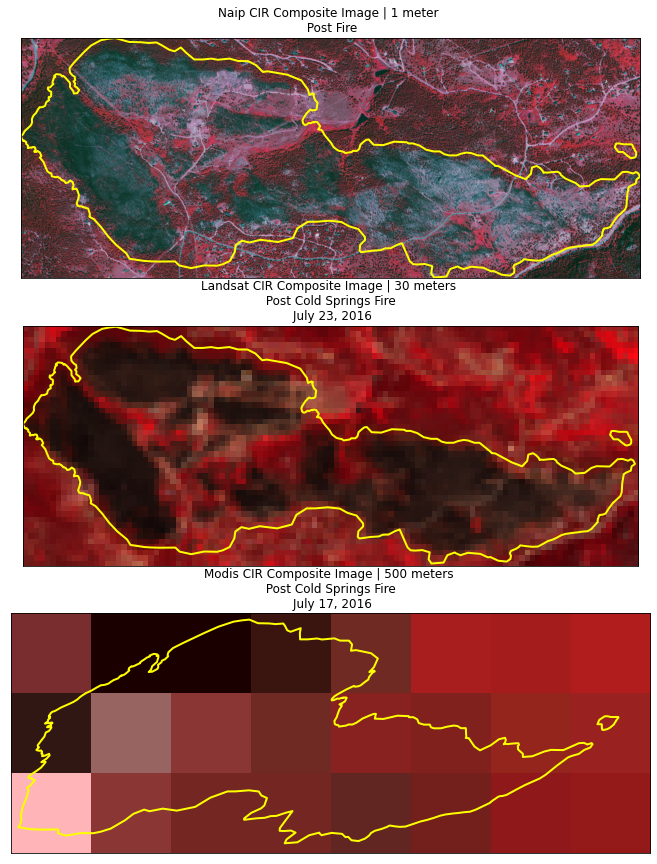
Homework Figure 1 - Grid of 3 Color InfraRed (CIR) Post-Fire Plots: NAIP, Landsat and MODIS
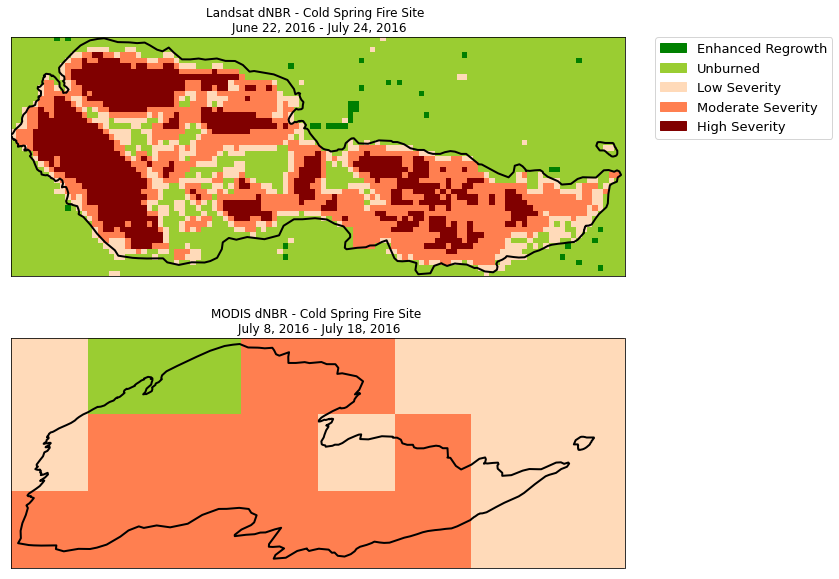
Homework Figure 3 - Difference NBR (dNBR) Using Landsat & MODIS
<xarray.DataArray (y: 44, x: 113)>
array([[2., 2., 2., ..., 2., 2., 2.],
       [2., 2., 2., ..., 2., 2., 2.],
       [2., 2., 2., ..., 2., 2., 2.],
       ...,
       [2., 2., 2., ..., 2., 2., 2.],
       [2., 2., 2., ..., 2., 2., 2.],
       [2., 2., 2., ..., 2., 2., 2.]])
Coordinates:
  * x            (x) float64 4.577e+05 4.577e+05 4.577e+05 ... 4.61e+05 4.61e+05
  * y            (y) float64 4.426e+06 4.426e+06 ... 4.425e+06 4.425e+06
    band         int64 1
    spatial_ref  int64 0
xarray.DataArray
- y: 44
- x: 113
- 2.0 2.0 2.0 2.0 2.0 2.0 2.0 2.0 ... 2.0 2.0 2.0 2.0 2.0 2.0 2.0 2.0
array([[2., 2., 2., ..., 2., 2., 2.], [2., 2., 2., ..., 2., 2., 2.], [2., 2., 2., ..., 2., 2., 2.], ..., [2., 2., 2., ..., 2., 2., 2.], [2., 2., 2., ..., 2., 2., 2.], [2., 2., 2., ..., 2., 2., 2.]]) - x(x)float644.577e+05 4.577e+05 ... 4.61e+05
- axis :
- X
- long_name :
- x coordinate of projection
- standard_name :
- projection_x_coordinate
- units :
- metre
array([457680., 457710., 457740., 457770., 457800., 457830., 457860., 457890., 457920., 457950., 457980., 458010., 458040., 458070., 458100., 458130., 458160., 458190., 458220., 458250., 458280., 458310., 458340., 458370., 458400., 458430., 458460., 458490., 458520., 458550., 458580., 458610., 458640., 458670., 458700., 458730., 458760., 458790., 458820., 458850., 458880., 458910., 458940., 458970., 459000., 459030., 459060., 459090., 459120., 459150., 459180., 459210., 459240., 459270., 459300., 459330., 459360., 459390., 459420., 459450., 459480., 459510., 459540., 459570., 459600., 459630., 459660., 459690., 459720., 459750., 459780., 459810., 459840., 459870., 459900., 459930., 459960., 459990., 460020., 460050., 460080., 460110., 460140., 460170., 460200., 460230., 460260., 460290., 460320., 460350., 460380., 460410., 460440., 460470., 460500., 460530., 460560., 460590., 460620., 460650., 460680., 460710., 460740., 460770., 460800., 460830., 460860., 460890., 460920., 460950., 460980., 461010., 461040.]) - y(y)float644.426e+06 4.426e+06 ... 4.425e+06
- axis :
- Y
- long_name :
- y coordinate of projection
- standard_name :
- projection_y_coordinate
- units :
- metre
array([4426440., 4426410., 4426380., 4426350., 4426320., 4426290., 4426260., 4426230., 4426200., 4426170., 4426140., 4426110., 4426080., 4426050., 4426020., 4425990., 4425960., 4425930., 4425900., 4425870., 4425840., 4425810., 4425780., 4425750., 4425720., 4425690., 4425660., 4425630., 4425600., 4425570., 4425540., 4425510., 4425480., 4425450., 4425420., 4425390., 4425360., 4425330., 4425300., 4425270., 4425240., 4425210., 4425180., 4425150.]) - band()int641
array(1)
- spatial_ref()int640
- spatial_ref :
- PROJCS["WGS 84 / UTM zone 13N",GEOGCS["WGS 84",DATUM["WGS_1984",SPHEROID["WGS 84",6378137,298.257223563,AUTHORITY["EPSG","7030"]],AUTHORITY["EPSG","6326"]],PRIMEM["Greenwich",0,AUTHORITY["EPSG","8901"]],UNIT["degree",0.0174532925199433,AUTHORITY["EPSG","9122"]],AUTHORITY["EPSG","4326"]],PROJECTION["Transverse_Mercator"],PARAMETER["latitude_of_origin",0],PARAMETER["central_meridian",-105],PARAMETER["scale_factor",0.9996],PARAMETER["false_easting",500000],PARAMETER["false_northing",0],UNIT["metre",1,AUTHORITY["EPSG","9001"]],AXIS["Easting",EAST],AXIS["Northing",NORTH],AUTHORITY["EPSG","32613"]]
- crs_wkt :
- PROJCS["WGS 84 / UTM zone 13N",GEOGCS["WGS 84",DATUM["WGS_1984",SPHEROID["WGS 84",6378137,298.257223563,AUTHORITY["EPSG","7030"]],AUTHORITY["EPSG","6326"]],PRIMEM["Greenwich",0,AUTHORITY["EPSG","8901"]],UNIT["degree",0.0174532925199433,AUTHORITY["EPSG","9122"]],AUTHORITY["EPSG","4326"]],PROJECTION["Transverse_Mercator"],PARAMETER["latitude_of_origin",0],PARAMETER["central_meridian",-105],PARAMETER["scale_factor",0.9996],PARAMETER["false_easting",500000],PARAMETER["false_northing",0],UNIT["metre",1,AUTHORITY["EPSG","9001"]],AXIS["Easting",EAST],AXIS["Northing",NORTH],AUTHORITY["EPSG","32613"]]
- GeoTransform :
- 457665.0 30.0 0.0 4426455.0 0.0 -30.0
array(0)
<xarray.DataArray (y: 3, x: 8)>
array([[3., 2., 2., 4., 4., 3., 3., 3.],
       [3., 4., 4., 4., 3., 4., 3., 3.],
       [4., 4., 4., 4., 4., 4., 3., 3.]])
Coordinates:
  * y            (y) float64 4.446e+06 4.446e+06 4.445e+06
  * x            (x) float64 -8.988e+06 -8.988e+06 ... -8.986e+06 -8.985e+06
    band         int64 1
    spatial_ref  int64 0
xarray.DataArray
- y: 3
- x: 8
- 3.0 2.0 2.0 4.0 4.0 3.0 3.0 3.0 ... 4.0 4.0 4.0 4.0 4.0 4.0 3.0 3.0
array([[3., 2., 2., 4., 4., 3., 3., 3.], [3., 4., 4., 4., 3., 4., 3., 3.], [4., 4., 4., 4., 4., 4., 3., 3.]]) - y(y)float644.446e+06 4.446e+06 4.445e+06
- axis :
- Y
- long_name :
- y coordinate of projection
- standard_name :
- projection_y_coordinate
- units :
- metre
array([4446180.484159, 4445717.171443, 4445253.858726])
- x(x)float64-8.988e+06 ... -8.985e+06
- axis :
- X
- long_name :
- x coordinate of projection
- standard_name :
- projection_x_coordinate
- units :
- metre
array([-8988498.356997, -8988035.04428 , -8987571.731564, -8987108.418847, -8986645.106131, -8986181.793414, -8985718.480698, -8985255.167981]) - band()int641
array(1)
- spatial_ref()int640
- spatial_ref :
- PROJCS["unnamed",GEOGCS["Unknown datum based upon the custom spheroid",DATUM["Not specified (based on custom spheroid)",SPHEROID["Custom spheroid",6371007.181,0]],PRIMEM["Greenwich",0],UNIT["degree",0.0174532925199433,AUTHORITY["EPSG","9122"]]],PROJECTION["Sinusoidal"],PARAMETER["longitude_of_center",0],PARAMETER["false_easting",0],PARAMETER["false_northing",0],UNIT["Meter",1],AXIS["Easting",EAST],AXIS["Northing",NORTH]]
- crs_wkt :
- PROJCS["unnamed",GEOGCS["Unknown datum based upon the custom spheroid",DATUM["Not specified (based on custom spheroid)",SPHEROID["Custom spheroid",6371007.181,0]],PRIMEM["Greenwich",0],UNIT["degree",0.0174532925199433,AUTHORITY["EPSG","9122"]]],PROJECTION["Sinusoidal"],PARAMETER["longitude_of_center",0],PARAMETER["false_easting",0],PARAMETER["false_northing",0],UNIT["Meter",1],AXIS["Easting",EAST],AXIS["Northing",NORTH]]
- GeoTransform :
- -8988730.01335511 463.3127165277089 0.0 4446412.1405174155 0.0 -463.312716527842
array(0)
Landsat vs MODIS Burned Area
Burned Landsat class 4:
Burned Landsat class 5:
Burned MODIS class 4:
Burned MODIS class 5:
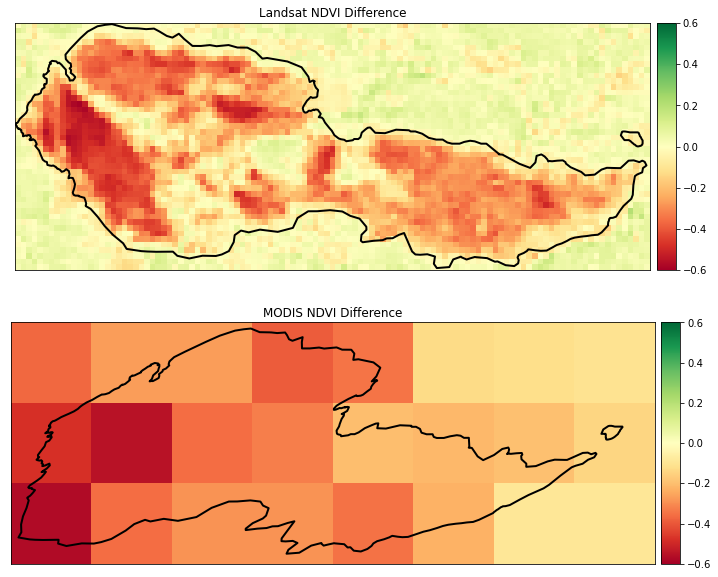
BONUS PLOT - Difference NDVI (dNDVI) Using Landsat & MODIS
Share on
Twitter Facebook Google+ LinkedIn