Introduction to Shapefiles and Vector Data in Open Source Python - Spatial Data
Welcome to Week 3!
Welcome to week 3 of Earth Analytics! This week, you will dive deeper into working with spatial data in Python. You will learn how to handle data in different coordinate reference systems, how to create custom maps and legends and how to extract data from a raster file. You are on your way towards integrating many different types of data into your analysis which involves knowing how to deal with things like coordinate reference systems and varying data structures.
What You Need
You will need a computer with internet access to complete this lesson and the spatial-vector-lidar data subset created for the course. Note that the data download below is large (172MB) however it contains data that you will use for the next 2 weeks! The best way to get the data is to use earthpy:
et.data.get_data("spatial-vector-lidar")
You can also download the data using the link below.
Download Spatial Lidar Teaching Data Subset data
or using the earthpy package: et.data.get_data("spatial-vector-lidar")
1. Complete the Assignment Below
Homework
The Homework Assignment for This Week Can Be Found on Github
Click here to view the GitHub Repo with the assignment template.
The lessons for this week have been moved to our Intermediate Earth Analytics Textbook.
Please read the following chapters to support completing this week’s assignment:
Downloading from https://ndownloader.figshare.com/files/12459464
Extracted output to /root/earth-analytics/data/spatial-vector-lidar/.
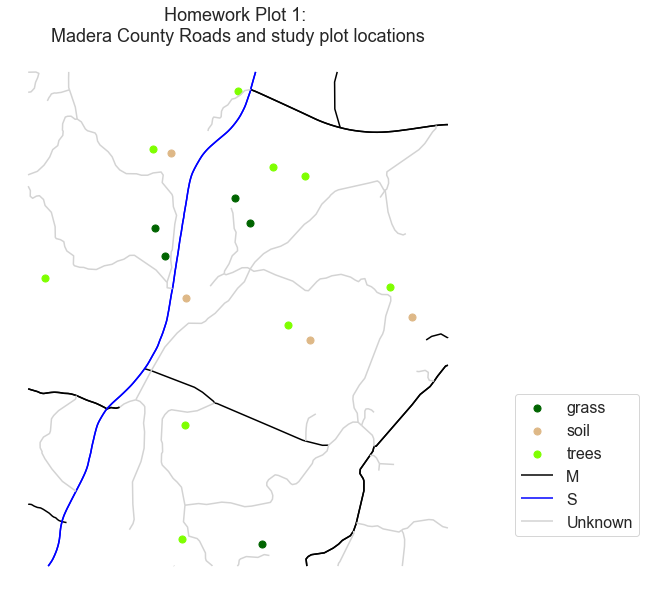
Plot 1 - Roads Map and Legend

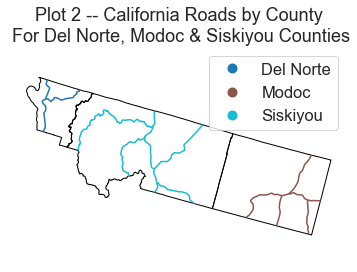
Plot 2 - Roads in Del Norte, Modoc & Siskiyou Counties in California

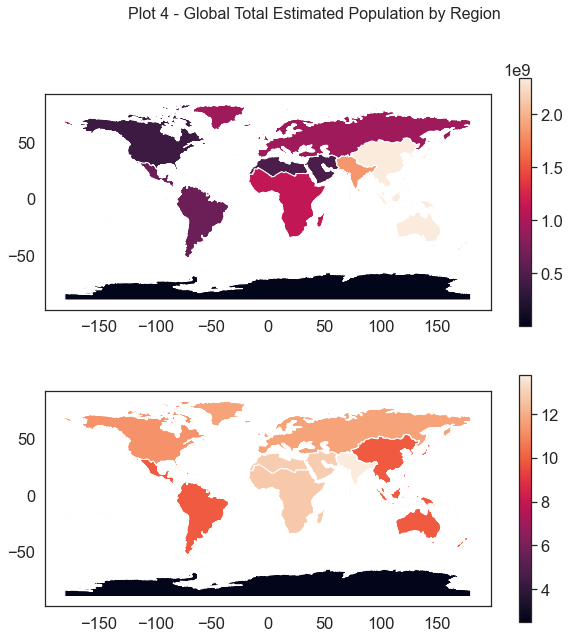
Plot 3 - Census Data
You can use the code below to download and unzip the data from the Natural Earth website. Please note that the download function was written to take
- a download path - this is the directory where you want to store your data
- a url - this is the URL where the data are located. The URL below might look odd as it has two “http” strings in it but it is how the url’s are organized on natural earth and should work.
The download() function will unzip your data for you and place it in the directory that you specify.
Downloading from https://naturalearth.s3.amazonaws.com/10m_cultural/ne_10m_admin_0_countries.zip
Extracted output to /root/earth-analytics/data/earthpy-downloads/ne_10m_admin_0_countries

Share on
Twitter Facebook Google+ LinkedIn