Learn to Create Efficient Data Workflows in Python
Welcome to Week 7!
Welcome to week 7 of Earth Analytics! This week you will learn how to automate a workflow using Python. You will design and implement your own workflow in Python that builds on the skills that you have learned in this course, such as functions and loops. You will also learn how to programmatically build paths to directories and files as well as parse strings to extract information from file and directory names.
Download Landsat Automation Data (~600 MB)
Or use earthpy et.data.get_data('ndvi-automation')
Materials to Review For This Week’s Assignment
Please be sure to review Chapter of Section 6 of the Intermediate Earth Analytics Textbook on Designing and Automating Data Workflows in Python.
Automate a Workflow in Python
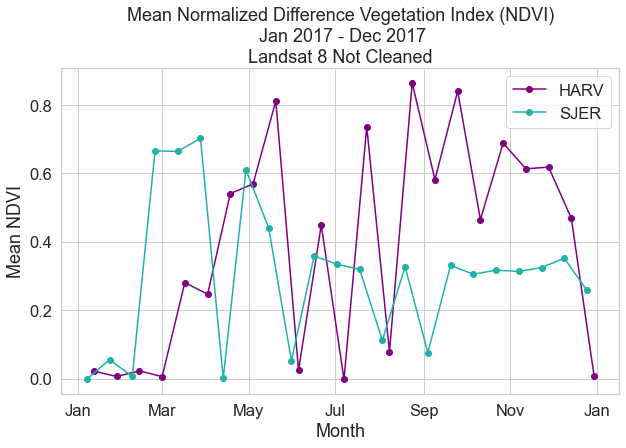
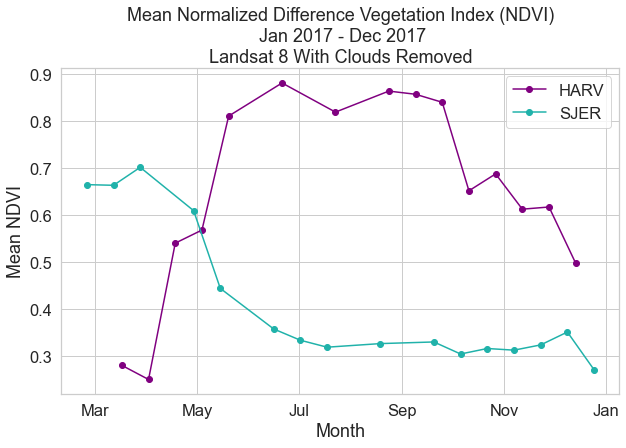
For this week’s assignment, you will generate a plot of the normalized difference vegetation index (NDVI) for two different locations in the United States to begin to understand how the growing seasons vary in each site:
- San Joaquin Experimental Range (SJER) in Southern California, United States
- Harvard Forest (HARV) in the Eastern United States
From this plot, you will be able to compare the seasonal vegetation patterns of the two locations. This comparison would be useful if you were planning NEON’s upcoming flight season in both locations and wanted to ensure that you flew the area when the vegetation was the most green! If could also be useful if you wanted to track green-up as it happened over time in both sites to see if there were changes happening.
As a bonus, you will also create a stacked NDVI output data product to share with your colleagues. You are doing all of the work to clean and process the data. It would be nice if you could share a data product output to save others the hassle.
Design A Workflow
Your goal this week is to calculate the mean NDVI value for each Landsat 8 scene captured for a NEON site over a year. You have the following data to do accomplish this goal:
- One year worth of Landsat 8 data for each site: Remember that for each landsat scene, you have a series of geotiff files representing bands and qa (quality assurance) layers in your data.
- A site boundary “clip file” for each site: This is a shapefile representing the boundary of each NEON site. You will want to clip your landsat data to this boundary.
Before writing Python code, write pseudocode for your implementation. Pseudo-coding means that you will write out all of the steps that you need to perform. Then, you will identify areas where tasks are repeated that could benefit from a function, areas where loops might be appropriate, etc.
Homework Plots
The plots below are examples of what your output plots will look like with and without cleaning the data to deal with cloud cover.


Share on
Twitter Facebook Google+ LinkedIn