Multispectral Imagery Python - NAIP, Landsat, Fire & Remote Sensing
Welcome to Week 6!
Welcome to week 6 of Earth Analytics!
At the end of this week you will be able to:
- Describe what a spectral band is in remote sensing data.
- Create maps of spectral remote sensing data using different band combinations including CIR and RGB.
- Calculate NDVI in
Pythonusing. - Get NAIP remote sensing data from Earth Explorer.
- Use the Landsat file naming convention to determine correct band combinations for plotting and calculating NDVI.
- Define additive color model.
Download Cold Springs Fire Data (~150 MB)
Or use earthpy et.data.get_data('cold-springs-fire')
The Homework Assignment for This Week Can Be Found on Github
Click here to view the GitHub Repo with the assignment template.
Please be sure to read Chapters 7-9 and 11 of Section 5 of the Intermediate Earth Analytics Textbook on Multispectral Remote Sensing Data in Python.
Please be sure to read about the Cold Springs fire in Chapter 22 of Section 7 of the Intermediate Earth Analytics Textbook.
1a. Remote Sensing Readings
- NASA Overview of Landsat 8
- Penn State e-Education post on multi-spectral data. Note they discuss AVHRR at the top which you won’t use in this lesson but be sure to read about Landsat.
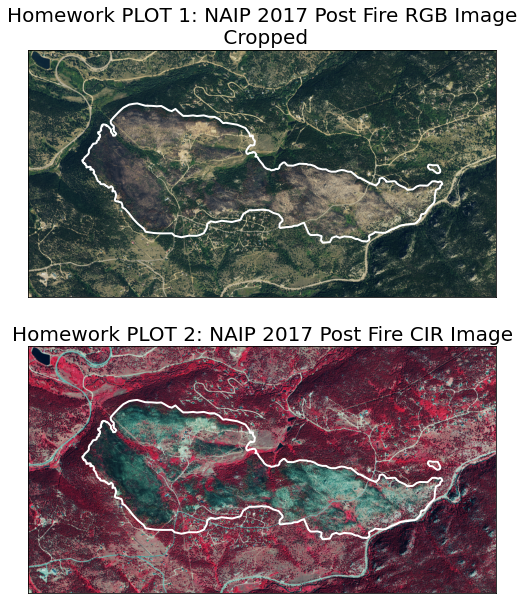
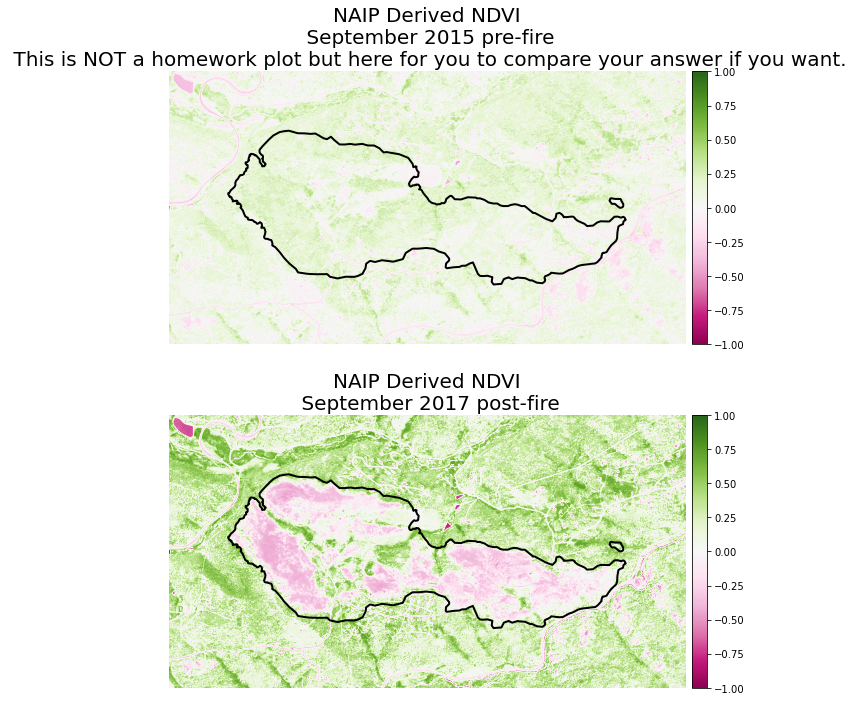
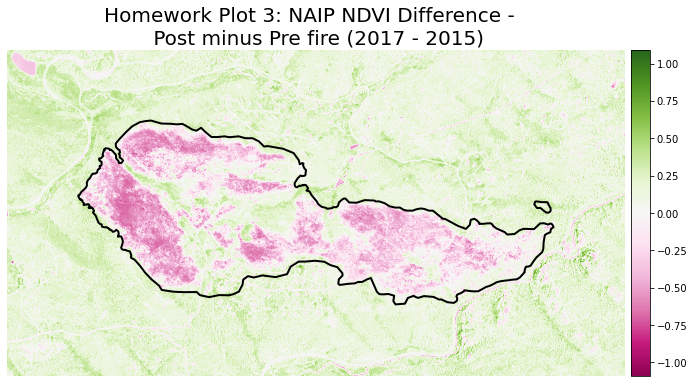
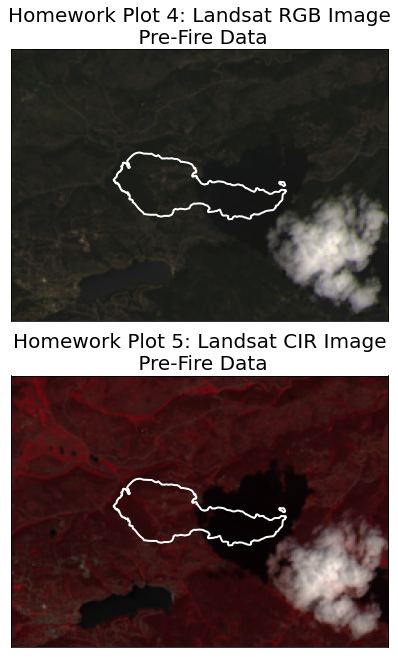
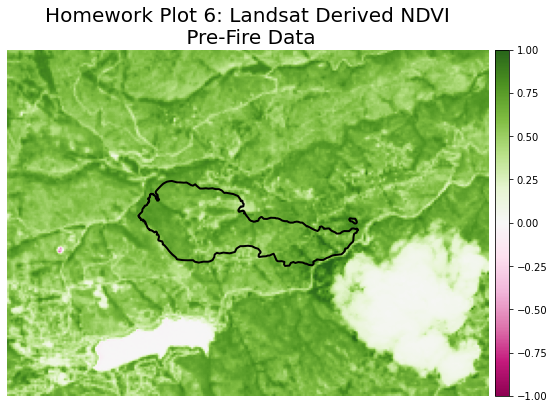
The intermediate NDVI plots below are not required for your homework. They are here so you can compare intermediate outputs if you want to! You will need to create these datasets to process the final NDVI difference plot that is a homework item!
Share on
Twitter Facebook Google+ LinkedIn