Earth Analytics Python Course - Week One
Welcome to Week One!
Welcome to the first week the Earth Analytics Python course! This week you will explore data in class related to the 2013 Colorado Floods.
Homework 1: Due Next Week
You will begin working on your first assignment that relates to data associated with the 2013 Colorado flood. This assignment will test skills learned in the Bootcamp course which is a pre-requisite requirement for this course!
The details of this assignment are in your first GitHub Classroom assignment repo (link in Canvas).
1. Readings
Colorado Flood Overview: This chapter will provide some background on the flood event and some data associated with understanding the events drivers and impacts.
Raster data: We will be covering raster data in Python in more details next week. However you can get a jump start if you want to review these lessons.
Review Readings (OPTIONAL)
- Time Series Review: You covered working with pandas and timeseries data in the bootcamp. These lessons review what you learned.
2. Watch Short Videos On the 2013 Colorado Floods
This 4 minute video will help you understand what happened during the 2013 floods in Colorado. It will also help you understand the flood data that you will use during the next few weeks of this class.
Before / After Google Earth Fly Through
This 12 second section of the previous video shows imagery collected before and after the 2013 floods in the Lee Hill Road, Boulder area.
Important: It is important to start on this report assignment early as it will take you some time to complete. Start today so you can focus on the raster data additions to the report next week!
Requirements
You will need the Earth Analytics Python environment to complete all of the assignments for this semester’s course. This environment is the same environment that you used in the Earth Analytics bootcamp. If you don’t already have this setup on your computer, review the setup instructions below. Setup Earth Analytics Python Environment on Your Laptop
Alternatively, if you are enrolled in this course, you can use our Jupyter Hub which contains all of the tools needed to complete the assignments. The course Jupyter Hub will give you access to more computing resources. We can also easily troubleshoot issues if your environment is not working.
If you wish to use our course Jupyter Hub, and do not already have access, please add your github username to the GitHub discussion in Canvas. Your instructor will then provide you with access to the hub.
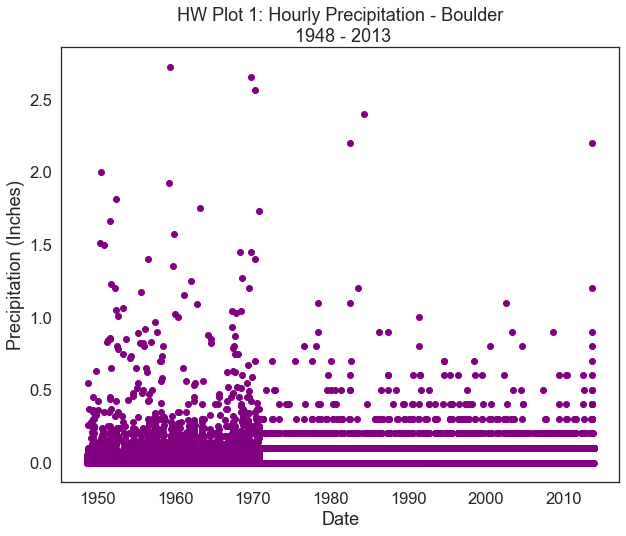
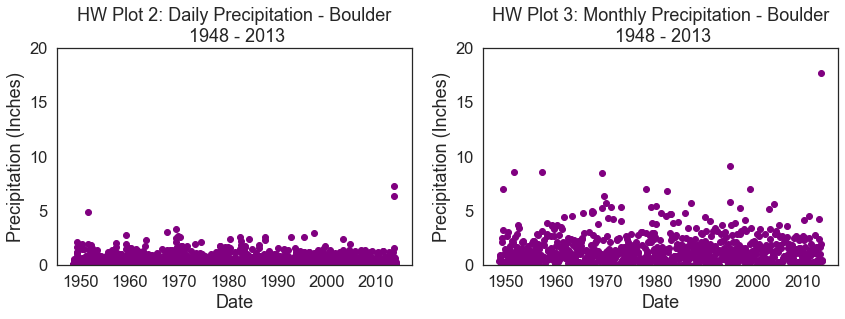
Your Homework Plot Should Look Something Like The Plots Below
It is OK if the dates are not formatted properly on your plot. You will learn how to handle dates next week!
Share on
Twitter Facebook Google+ LinkedIn