Lesson 1. Use Google Earth Time Series Images to View Flood Impacts
Understand Disturbance with Data - Flooding and Erosion - Earth analytics python course module
Welcome to the first lesson in the Understand Disturbance with Data - Flooding and Erosion module. This module uses time series data to explore the impacts of a flood. Learn how to use Google Earth imagery, NOAA precipitation data and USGS stream flow data to explore the 2013 Colorado floods.In this lesson, you will learn to use the time series function in Google Earth to explore changes in the landscape associated with the 2013 Colorado floods.
Learning Objectives
At the end of this activity, you will be able to:
- Use the timeline function in Google Earth to view time series imagery data.
- Identify and describe a driver and an impact of a flood event.
What You Need
You will need to download and install Google Earth on your computer and then
download the .kml file below.
About the 2013 Colorado Floods
In early September 2013, a slow moving cold air front moved through Colorado, USA intersecting with a warm, humid air front. The clash between the cold and warm airs fronts yielded heavy rain. This rain, combined with a drought conditions, Colorado soil conditions and other factors yielded devastating flooding across the Front Range in Colorado, USA.
Use Imagery to Detect Change
Spatially located (georeferenced) imagery, collected using satellites and airplanes provides a powerful visual record of landscape changes. Google Earth, has a time series feature that allows you to look at imagery of the earth, across time in certain areas of the Earth.
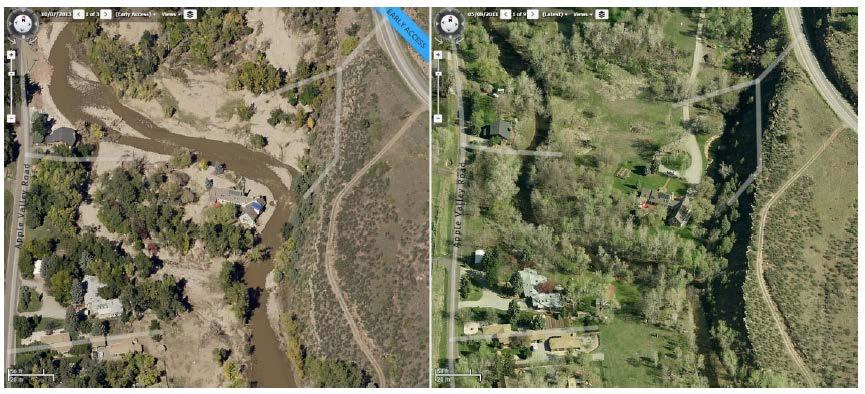
You will use this feature to look at the landscape in Boulder, Colorado both before and after the floods.
How to View Time Series Imagery in Google Earth
- Open Google Earth
- Double click on the
.kmzfile that you downloaded above. It should open in Google Earth.
Data Tip:
If the .kmz file doesn’t automatically open when you double click on it, try to Open Google Earth, go to File –> Open in Google Earth. Finally, navigate to the location of your downloaded file (~Documents/data/co-flood/locations) and open it.
- Once you have the
.kmzfile open, notice it is listed in the Temporary Places section of theplaceswindow. It should automatically zoom you into to an area in North Boulder, Colorado. If it doesn’t double click on the textLocations of Significant Damage. - Click on the show historical imagery button in Google Earth
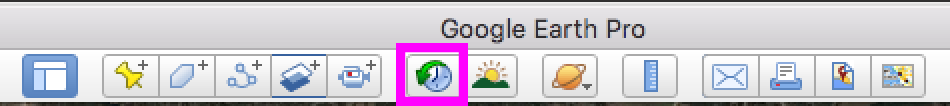
- When you click on the show historical imagery, a slider will appear in the upper LEFT hand corner of your window. Scroll back and forth through time to get used to the slider
- Finally, double click on one of the thumbtacks from
Locations of Significant Damage. Scroll to 10/2012 and then to 10/2013. Do you see any differences? - Check out the other thumbtack. What differences do you see?
Activity: What Changes Do You See?
This activity is a required part of your homework. If you are in class however, you can complete this during the class period. As a group, discuss the following questions.
- What differences do you see in the landscape between 2012 and 2013?
- For each difference: What do you think caused that difference?
- For each difference: How can you quantitatively record the difference?
- For each CAUSE listed above, could you somehow quantitatively record the “size” or impact of the cause?
- Was the cause - caused by something else (i.e. did something else DRIVE the cause)?
Now, go to the Canvas Discussion page. In the wk1-google-earth-activity create a new post that includes:
- atleast 3 differences or changes that your group noticed in the imagery
- what data you could use to quantify each different that you noticed
- what might have caused that change in the landscape?
- How would you measure that driver that caused the change in the landscape
Consider organizing your response in a table like the one below. Do not use the example below in your Canvas Discussion page post UNLESS you can come up with another way to quantify how many (or the degree to which) trees were lost! Also note the example provided below is using manually measured data. You may know of other ways to measure tree loss!
An example table that shows what you might post in the Canvas Discussion page:
| Difference | Data you can use to quantify the change | What drove the change | How could you quantify that driver |
|---|---|---|---|
| Trees are missing after the flood | human field survey of trees | Large boulders swept downstream by flood waters | changes in terrain pre-post flood |
When you have completed your post, as an individual, find atleast 2 other posts that you like and comment on them.
Share on
Twitter Facebook Google+ LinkedIn
Leave a Comment