Lesson 5. Analyze The Sentiment of Tweets From Twitter Data and Tweepy in Python
Learning Objectives
After completing this tutorial, you will be able to:
- Explain how text data can be analyzed to identify sentiments (i.e. attitudes) toward a particular subject.
- Analyze sentiments in tweets.
What You Need
You will need a computer with internet access to complete this lesson.
Sentiment Analysis
Sentiment analysis is a method of identifying attitudes in text data about a subject of interest. It is scored using polarity values that range from 1 to -1. Values closer to 1 indicate more positivity, while values closer to -1 indicate more negativity.
In this lesson, you will apply sentiment analysis to Twitter data using the Python package textblob. You will calculate a polarity value for each tweet on a given subject and then plot these values in a histogram to identify the overall sentiment toward the subject of interest.
Get and Clean Tweets Related to Climate
Begin by reviewing how to search for and clean tweets that you will use to analyze sentiments in Twitter data.
test - force trigger rebuild
import os
import pandas as pd
import matplotlib.pyplot as plt
import seaborn as sns
import itertools
import collections

import tweepy as tw
import nltk
from nltk.corpus import stopwords
import re
import networkx
from textblob import TextBlob

import warnings
warnings.filterwarnings("ignore")

sns.set(font_scale=1.5)
sns.set_style("whitegrid")
/opt/conda/lib/python3.8/site-packages/nltk/parse/malt.py:206: SyntaxWarning: "is not" with a literal. Did you mean "!="?
  if ret is not 0:
Remember to define your keys:
consumer_key= 'yourkeyhere'
consumer_secret= 'yourkeyhere'
access_token= 'yourkeyhere'
access_token_secret= 'yourkeyhere'
auth = tw.OAuthHandler(consumer_key, consumer_secret)
auth.set_access_token(access_token, access_token_secret)
api = tw.API(auth, wait_on_rate_limit=True)
Using what you have learned in the previous lessons, grab and clean up 1000 recent tweets. For this analysis, you only need to remove URLs from the tweets.
def remove_url(txt):
    """Replace URLs found in a text string with nothing
    (i.e. it will remove the URL from the string).

    Parameters
    ----------
    txt : string
        A text string that you want to parse and remove urls.

    Returns
    -------
    The same txt string with url's removed.
    """

    return " ".join(re.sub("([^0-9A-Za-z \t])|(\w+:\/\/\S+)", "", txt).split())
# Create a custom search term and define the number of tweets
search_term = "#climate+change -filter:retweets"

tweets = tw.Cursor(api.search,
                   q=search_term,
                   lang="en",
                   since='2018-11-01').items(1000)

# Remove URLs
tweets_no_urls = [remove_url(tweet.text) for tweet in tweets]
Analyze Sentiments in Tweets
You can use the Python package textblob to calculate the polarity values of individual tweets on climate change.
Begin by creating textblob objects, which assigns polarity values to the tweets. You can identify the polarity value using the attribute .polarity of texblob object.
# Create textblob objects of the tweets
sentiment_objects = [TextBlob(tweet) for tweet in tweets_no_urls]

sentiment_objects[0].polarity, sentiment_objects[0]
(0.35,
 TextBlob("CLIMATE change causing wildfires to become more intense GlobalWarming climatechange"))
You can apply list comprehension to create a list of the polarity values and text for each tweet, and then create a Pandas Dataframe from the list.
# Create list of polarity valuesx and tweet text
sentiment_values = [[tweet.sentiment.polarity, str(tweet)] for tweet in sentiment_objects]

sentiment_values[0]
[0.35,
 'CLIMATE change causing wildfires to become more intense GlobalWarming climatechange']
# Create dataframe containing the polarity value and tweet text
sentiment_df = pd.DataFrame(sentiment_values, columns=["polarity", "tweet"])

sentiment_df.head()
| polarity | tweet | |
|---|---|---|
| 0 | 0.35000 | CLIMATE change causing wildfires to become mor... |
| 1 | 0.35000 | CLIMATE change causing wildfires to become mor... |
| 2 | 0.11875 | Anthony Fauci and other experts see the potent... |
| 3 | 0.35000 | Im surprised there are still ClimateChange den... |
| 4 | -0.51250 | The links between humancaused climate change a... |
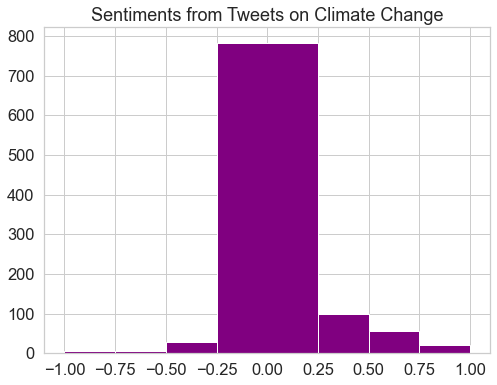
These polarity values can be plotted in a histogram, which can help to highlight in the overall sentiment (i.e. more positivity or negativity) toward the subject.
fig, ax = plt.subplots(figsize=(8, 6))

# Plot histogram of the polarity values
sentiment_df.hist(bins=[-1, -0.75, -0.5, -0.25, 0.25, 0.5, 0.75, 1],
             ax=ax,
             color="purple")

plt.title("Sentiments from Tweets on Climate Change")
plt.show()

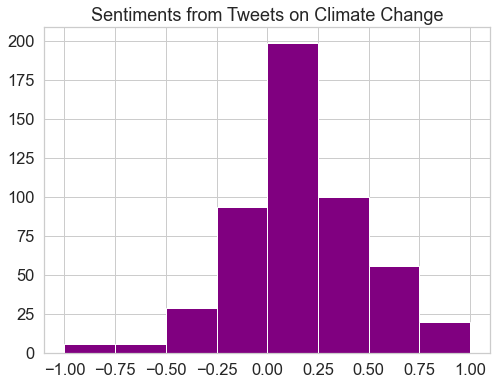
To get a better visual of the polarit values, it can be helpful to remove the polarity values equal to zero and create a break in the histogram at zero.
# Remove polarity values equal to zero
sentiment_df = sentiment_df[sentiment_df.polarity != 0]
fig, ax = plt.subplots(figsize=(8, 6))

# Plot histogram with break at zero
sentiment_df.hist(bins=[-1, -0.75, -0.5, -0.25, 0.0, 0.25, 0.5, 0.75, 1],
             ax=ax,
             color="purple")

plt.title("Sentiments from Tweets on Climate Change")
plt.show()

What does the histogram of the polarity values tell you about sentiments in the tweets gathered from the search “#climate+change -filter:retweets”? Are they more positive or negative?
Get and Analyze Tweets Related to the Camp Fire
Next, explore a new topic, the 2018 Camp Fire in California.
Begin by searching for the tweets and combining the cleaning of the data (i.e. removing URLs) with the creation of the textblob objects.
search_term = "#CampFire -filter:retweets"

tweets = tw.Cursor(api.search,
                   q=search_term,
                   lang="en",
                   since='2018-09-23').items(1000)

# Remove URLs and create textblob object for each tweet
all_tweets_no_urls = [TextBlob(remove_url(tweet.text)) for tweet in tweets]

all_tweets_no_urls[:5]
[TextBlob("Watch the video to see the alerts from YubaNetFire TrishasWCFireWx engineco16 combined with the CampFires rap"),
 TextBlob("Enraging that I thought the CAMPFIREwas due to neglect from PGampE instead they are subjects of a command economy"),
 TextBlob("What about churches St Thomas More Catholic Church could easily accommodate this rule Weve lost more than half"),
 TextBlob("My house smells like a mega CAMPFIRE inside still waiting this walloffires out please pleaserain haven"),
 TextBlob("Holiday Mug Confetti Set naturecuts etsy confetti partysupplies party event birthday wedding babyshower")]
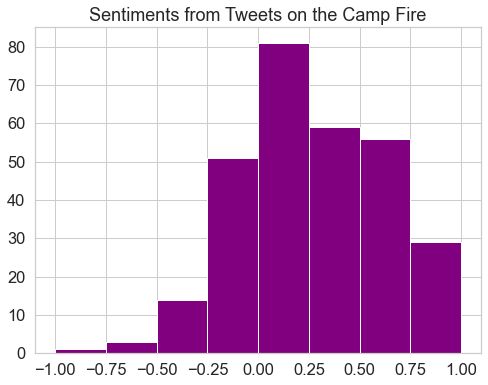
Then, you can create the Pandas Dataframe of the polarity values and plot the histogram for the Camp Fire tweets, just like you did for the climate change data.
# Calculate polarity of tweets
wild_sent_values = [[tweet.sentiment.polarity, str(tweet)] for tweet in all_tweets_no_urls]

# Create dataframe containing polarity values and tweet text
wild_sent_df = pd.DataFrame(wild_sent_values, columns=["polarity", "tweet"])
wild_sent_df = wild_sent_df[wild_sent_df.polarity != 0]

wild_sent_df.head()
| polarity | tweet | |
|---|---|---|
| 1 | -0.125000 | Enraging that I thought the CAMPFIREwas due to... |
| 2 | 0.253333 | What about churches St Thomas More Catholic Ch... |
| 6 | -0.333333 | MiekeEoyang The current fires are actually clo... |
| 8 | 0.500000 | NickAllardKIRO7 what does south Humboldt look ... |
| 11 | 0.550000 | Campfire treats have been devoured Popcorn and... |
fig, ax = plt.subplots(figsize=(8, 6))

wild_sent_df.hist(bins=[-1, -0.75, -0.5, -0.25, 0, 0.25, 0.5, 0.75, 1],
        ax=ax, color="purple")

plt.title("Sentiments from Tweets on the Camp Fire")
plt.show()

Based on this histogram, would you say that the sentiments from the Camp Fire tweets are more positive or negative?
Share on
Twitter Facebook Google+ LinkedIn
Leave a Comment