Lesson 4. Spatial Raster Metadata: CRS, Resolution, and Extent in Python
Learning Objectives
- Be able to define 3 spatial attributes of a raster dataset: extent, coordinate reference system and resolution.
- Access spatial metadata of a raster dataset in Python.
On this page, you will learn about three important spatial attributes associated with raster data that in this lesson:
- coordinate reference systems (CRS),
- resolution, and
- spatial extent.
1. Coordinate Reference System
The Coordinate Reference System or CRS of a spatial object tells Python where
the raster is located in geographic space. It also tells Python what mathematical method should
be used to “flatten” or project the raster in geographic space.
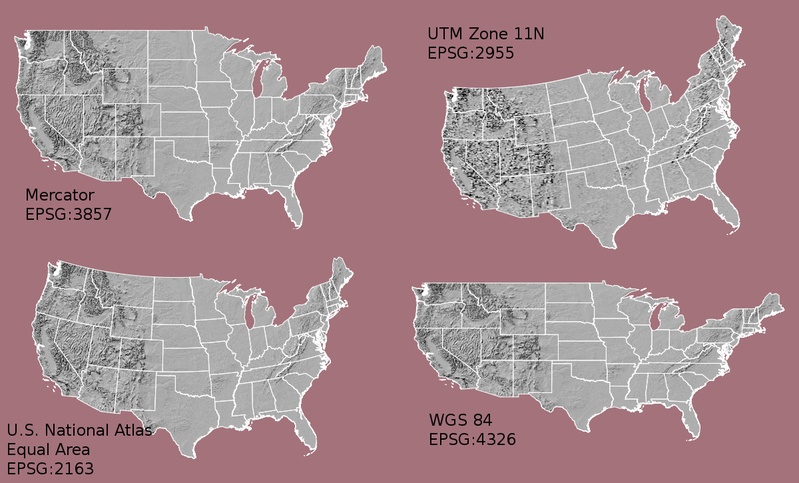
What Makes Spatial Data Line Up On A Map?
You will discuss Coordinate Reference systems in more detail in next weeks class. For this week, just remember that data from the same location but saved in different coordinate references systems will not line up in any GIS or other program.
Thus, it’s important when working with spatial data in a program like
Python to identify the coordinate reference system applied to the data and retain
it throughout data processing and analysis.
View Raster Coordinate Reference System (CRS) in Python
You can view the CRS string associated with your Python object using thecrs()
method.
# Import necessary packages
import os

import matplotlib.pyplot as plt
import rioxarray as rxr
import earthpy as et

# Get data and set working directory
et.data.get_data("colorado-flood")
os.chdir(os.path.join(et.io.HOME,
                      'earth-analytics',
                      'data'))
You can explore the metadata of a raster object using rioxarray.
To begin, open up your data and view the CRS.
# Define relative path to file
lidar_dem_path = os.path.join("colorado-flood",
                              "spatial",
                              "boulder-leehill-rd",
                              "pre-flood",
                              "lidar",
                              "pre_DTM.tif")

# View crs of raster imported with rasterio
lidar_dem = rxr.open_rasterio(lidar_dem_path, masked=True)
print("The CRS of this data is:", lidar_dem.rio.crs)
The CRS of this data is: EPSG:32613
You can assign this string to a Python object, too. The example below only shows the code example to set a crs for an object where it is missing and you know what the CRS should be. In this case your data already has a defined CRS so this step is not necessary.
a_crs = lidar_dem.rio.crs
# Assign crs to myCRS object - this is just an example of how you would do that
lidar_dem = lidar_dem.rio.set_crs(a_crs, inplace=True)
The CRS EPSG code for your lidar_dem object is 32613.
Next, you can look that EPSG code up on the spatial reference.org website to figure out what CRS it refers to and the associated units. In this case you are using UTM zone 13 North.
Digging deeper you can view the proj 4 string which tells us that the horizontal units of this project are in meters (m).
The CRS format, returned by python, is in a EPSG format. This means that the projection
information is represented by a single number. However on the spatialreference.org website you can also view the proj4 string which will tell you a bit more about the horizontal units that the data are in. An overview of proj4 is below.
+proj=utm +zone=18 +datum=WGS84 +units=m +no_defs +ellps=WGS84 +towgs84=0,0,0
Converting EPSG to Proj4 in Python
A python package for this class called ‘earthpy’ contains a dictionary that will help you convert EPSG codes into a Proj4 string. This can be used with rasterio in order to determine the metadata for a given EPSG code. For example, if you wish to know the units of the EPSG code above, you can do the following:
# Each key of the dictionary is an EPSG code
print(list(et.epsg.keys())[:10])
['29188', '26733', '24600', '32189', '4899', '29189', '26734', '7402', '26951', '29190']
You can convert to proj4 using earthpy:
# Convert to project string using earthpy
proj4 = et.epsg['32613']
print(proj4)
+proj=utm +zone=13 +datum=WGS84 +units=m +no_defs
You’ll focus on the first few components of the CRS in this tutorial.
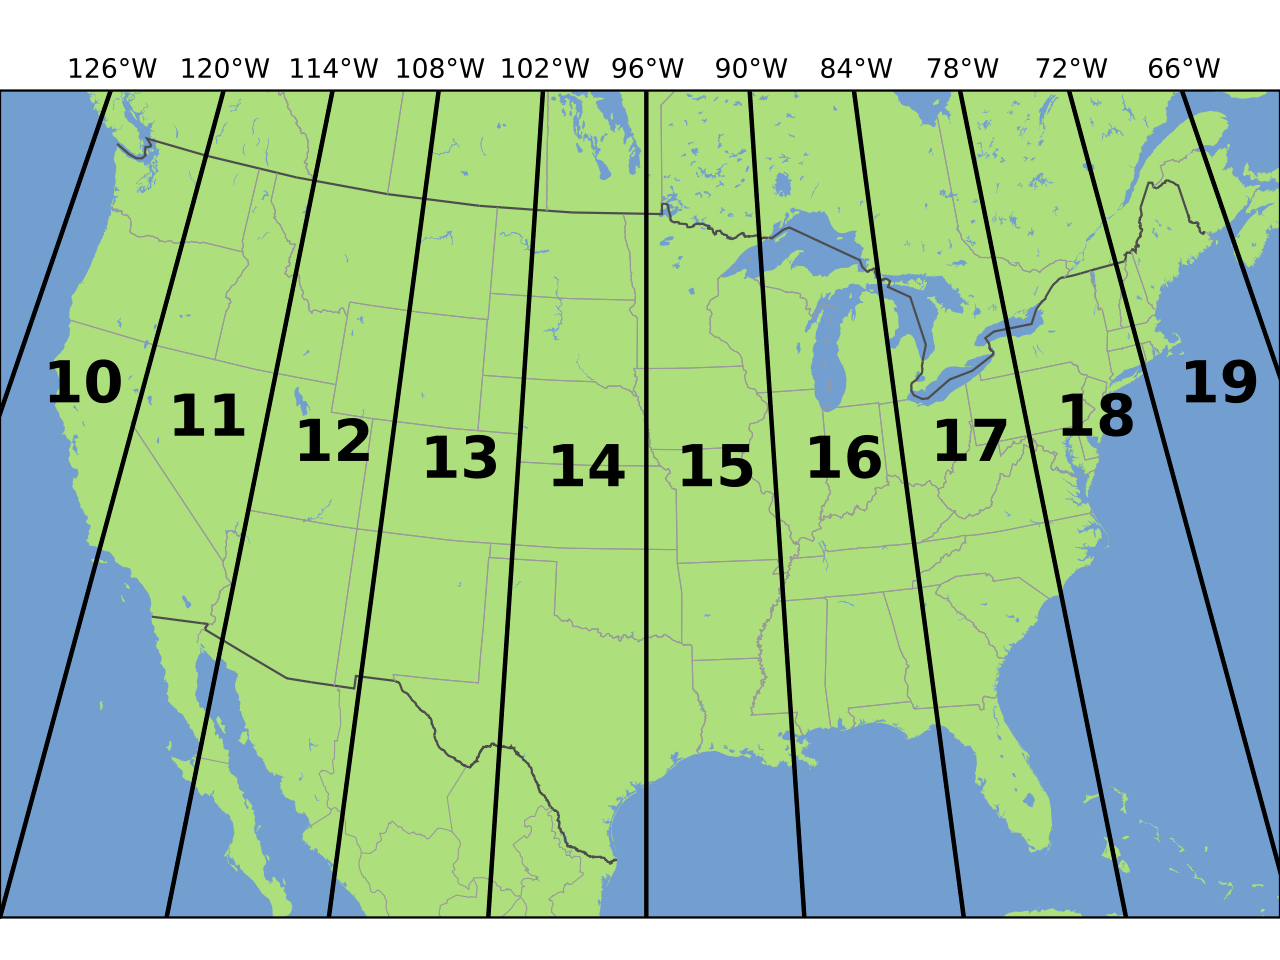
+proj=utmThe projection of the dataset. Your data are in Universal Transverse Mercator (UTM).+zone=18The UTM projection divides up the world into zones, this element tells you which zone the data is in. Harvard Forest is in Zone 18.+datum=WGS84The datum was used to define the center point of the projection. Your raster uses theWGS84datum.+units=mThis is the horizontal units that the data are in. Your units are meters.
Important: You are working with lidar data which has a Z or vertical value as well. While the horizontal units often match the vertical units of a raster they don’t always! Be sure the check the metadata of your data to figure out the vertical units!
Spatial Extent
Next, you’ll learn about spatial extent of your raster data. The spatial extent of a raster or spatial object is the geographic area that the raster data covers.
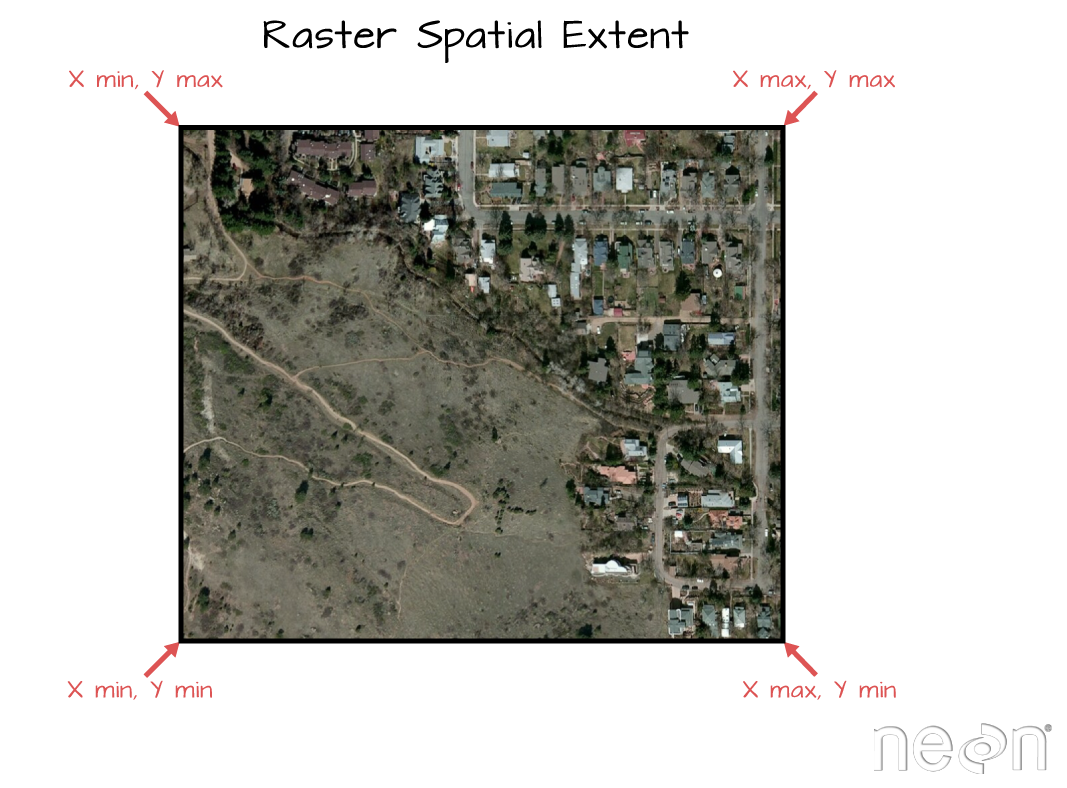
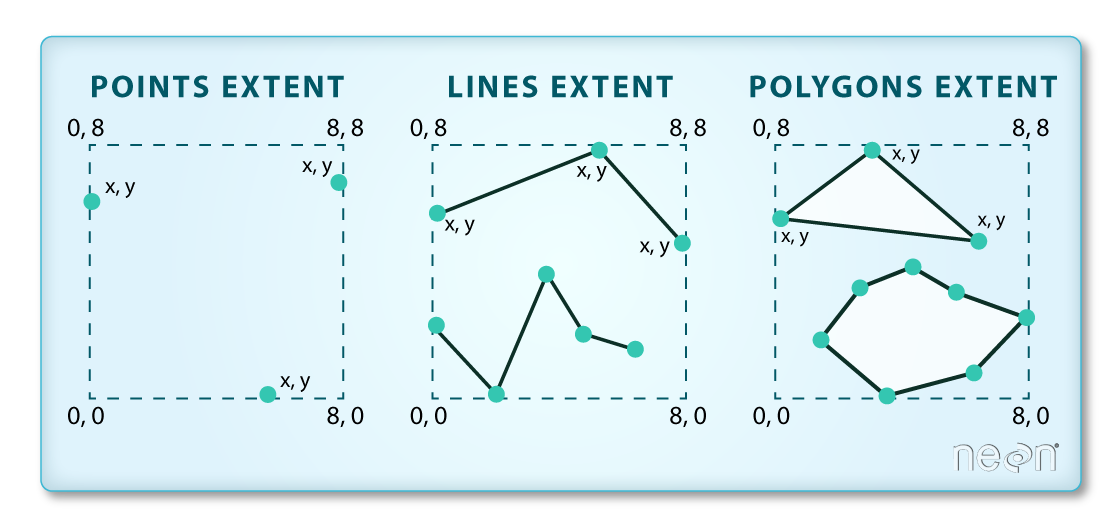
The spatial extent of an Python spatial object represents the geographic “edge” or
location that is the furthest north, south, east and west. In other words, extent
represents the overall geographic coverage of the spatial object.
You can access the spatial extent using the .bounds() attribute in rasterio.
lidar_dem.rio.bounds()
(472000.0, 4434000.0, 476000.0, 4436000.0)
Raster Resolution
A raster has horizontal (x and y) resolution. This resolution represents the
area on the ground that each pixel covers. The units for your data are in meters as determined by the CRS above.
In this case, your data resolution is 1 x 1. This means that each pixel represents
a 1 x 1 meter area on the ground. You can view the resolution of your data using the .res function.
# What is the x and y resolution for your raster data?
lidar_dem.rio.resolution()
(1.0, -1.0)
Above you have learned about the basic spatial metadata attributes of raster data.
In the following lesson you will learn more about the geotiff file format (.tif)
which is the file format used to store the lidar terrain models used throughout
this chapter.
Share on
Twitter Facebook Google+ LinkedIn