Lesson 4. Canopy Height Models, Digital Surface Models & Digital Elevation Models - Work With LiDAR Data in Python
Learning Objectives
- Define Canopy Height Model (CHM), Digital Elevation Model (DEM) and Digital Surface Model (DSM).
- Describe the key differences between the CHM, DEM, DSM.
As you learned in the previous lesson, LiDAR or Light Detection and Ranging is an active remote sensing system that can be used to measure vegetation height across wide areas.
If the data are discrete return, Lidar point clouds are most commonly derived data product from a lidar system. However, often people work with lidar data in raster format given it’s smaller in size and thus easier to work with. In this lesson, you will import and work with 3 of the most common lidar derived data products in Python:
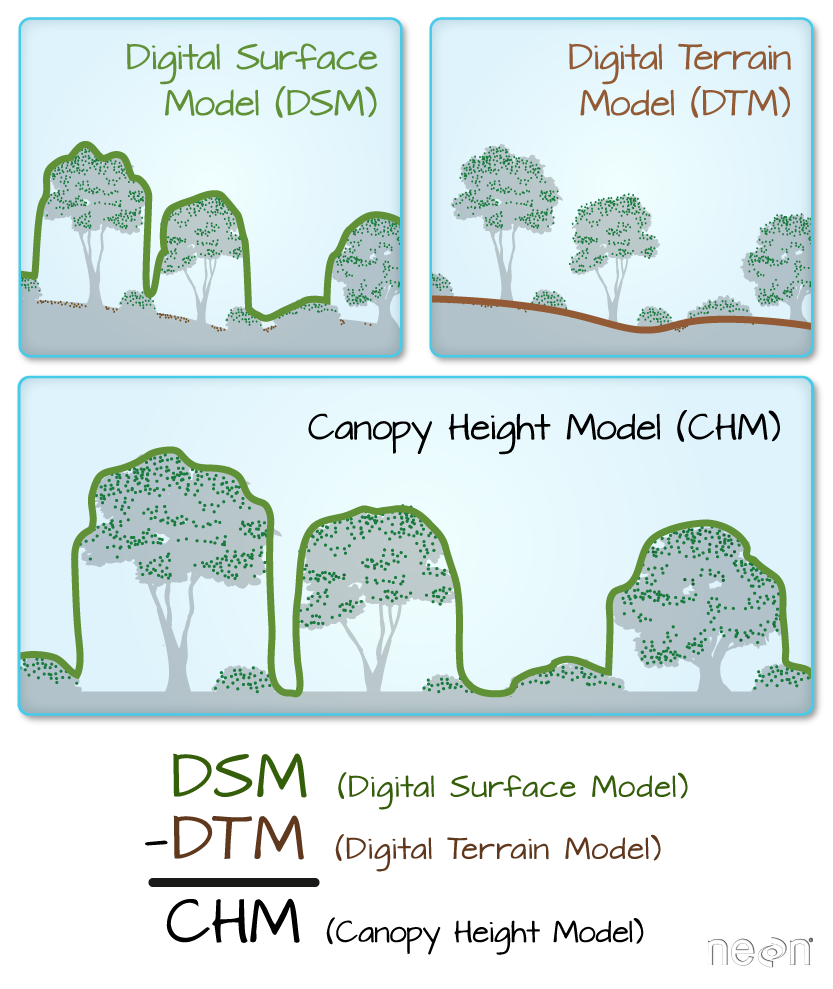
- Digital Terrain Model (or DTM): ground elevation.
- Digital Surface Model (or DSM): top of the surface (imagine draping a sheet over the canopy of a forest
- Canopy Height Model (CHM): the height or residual distance between the ground and the top of the of objects above the ground. This includes the actual heights of trees, builds and any other objects on the earth’s surface. This CHM is created by subtracting the DTM from the DSM.
Three Important Lidar Data Products: CHM, DEM, DSM

Digital Elevation Model
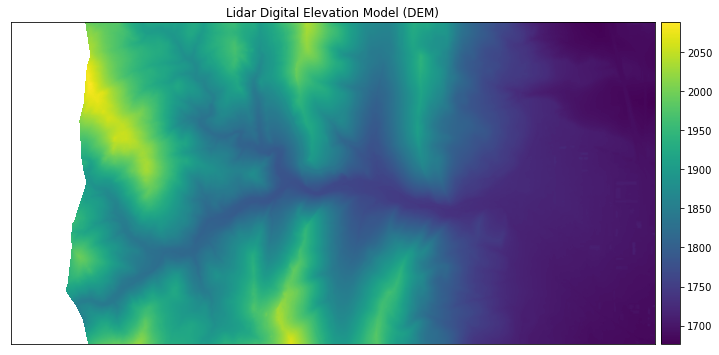
In the previous lesson, you opened and explored a digital elevation model (DEM). The DEM, also known as a digital terrain model (DTM) represents the elevation of the earth’s surface. The DEM represents the ground - and thus DOES NOT INCLUDE trees and buildings and other objects.
In this lesson, you will explore Digital Surface Models (DSM) and learn how to use the DEM and the DSM to create a canopy height model (CHM).

Import digital surface model (DSM)
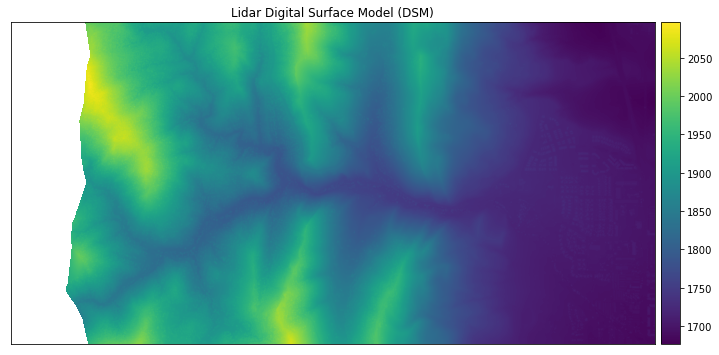
Next, let’s review the digital surface model (DSM). The DSM represents the top of the earth’s surface. Thus, it INCLUDES TREES, BUILDINGS and other objects that sit on the earth.

Canopy Height Model
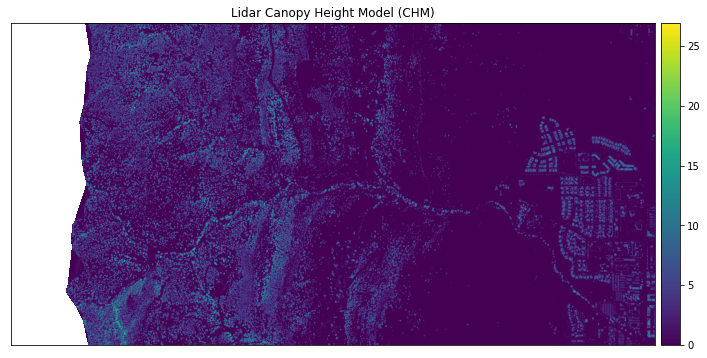
The canopy height model (CHM) represents the HEIGHT of the trees. This is not an elevation value, rather it’s the height or distance between the ground and the top of the trees (or buildings or whatever object that the lidar system detected and recorded).
Some canopy height models also include buildings, so you need to look closely at your data to make sure it was properly cleaned before assuming it represents all trees!
Calculate difference between two rasters
There are different ways to calculate a CHM. One easy way is to subtract the DEM from the DSM.
DSM - DEM = CHM
You can learn how to subtract rasters in the Use Data for Earth and Environmental Science in Open Source Python textbook.

Share on
Twitter Facebook Google+ LinkedIn