Lesson 3. Remote Sensing to Study Wildfire
Learning Objectives
- Explain how scientists use remote sensing to study wildfire impacts.
- List two primary vegetation indices that are used to study wildfire impacts.
- List four primary sources of remote sensing data that can be used to study wildfire.
Use Remote Sensing Data to Understand Fire Impacts
Remote sensing data are often used to study fires. Remote sensing data, collected from satellites and airplanes, allow you to gather information about the landscape over time. Data collected from satellites like Landsat and MODIS are freely available and collected regularly across the globe.
Since remote sensing data are collected over time, they can be used to, among other things:
- Track changes in vegetation.
- Understand the area and intensity of fires.
- Monitor the post-fire vegetation dynamics of burned areas.
Remote Sensing Derived Vegetation Indices to Understand Fire Impacts
Vegetation indices can be useful tools for quantifying and visualizing the before and after effects of wildfire. They are calculations performed on specific spectral bands of remotely sensed imagery to accentuate a particular vegetation characteristic. They can be used for anything from understanding disasters like floods or fires to deciding when to irrigate crops.
To calculate a vegetation index, you will need access to specific imagery bands across the electromagnetic spectrum; in other words, you will need access to satellite imagery with a certain spectral resolution.
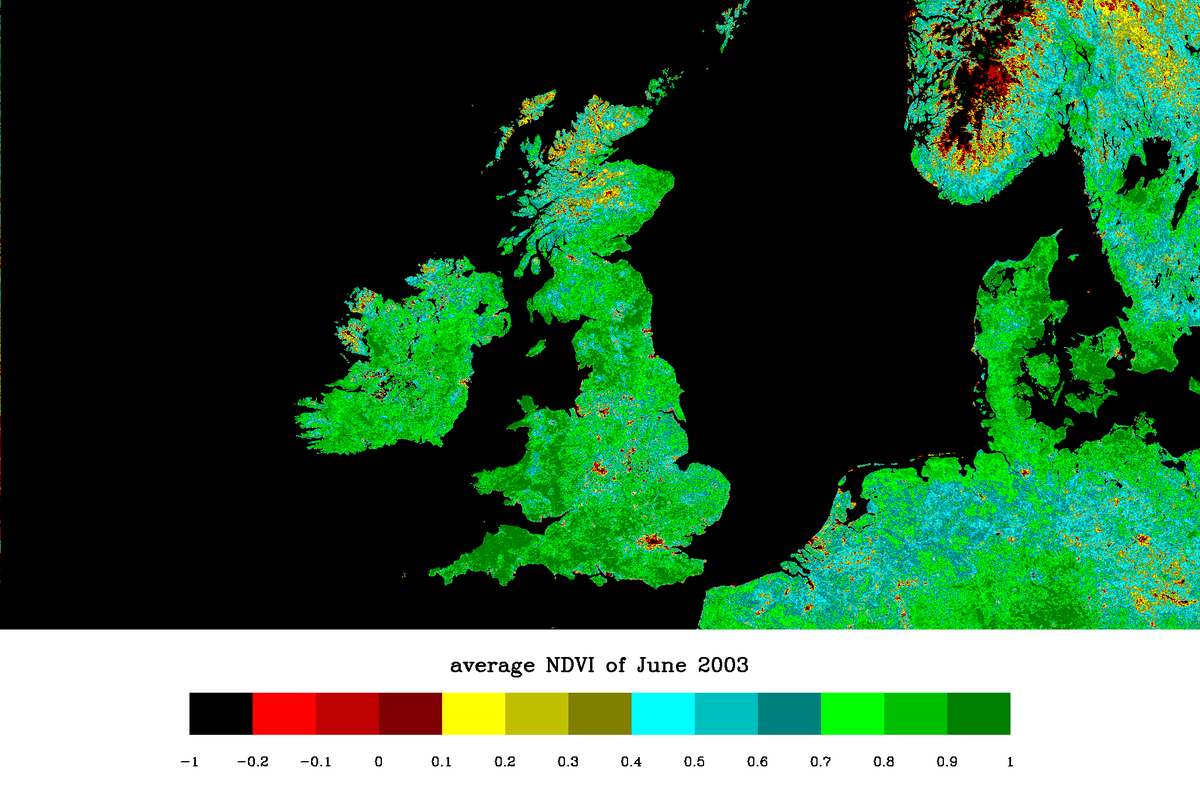
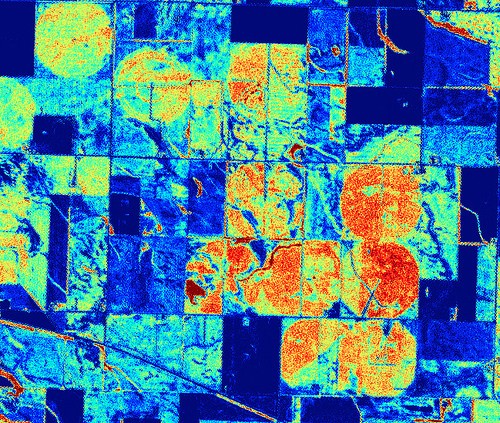
Normalized Difference Vegetation Index (NDVI)
The normalized difference vegetation index (NDVI) is a vegetation index that is used to measure the greenness of the area. For the purpose of studying wildfires like the Cold Springs Fire, it allows you to visualize and quantify vegetation health before and after the fire.
Further, you can use NDVI to track the rate of vegetation growing back in a burned area over time. This can tell you the speed of ecosystem recovery. In this course, you will learn how to calculate NDVI and create images like those below using Python.
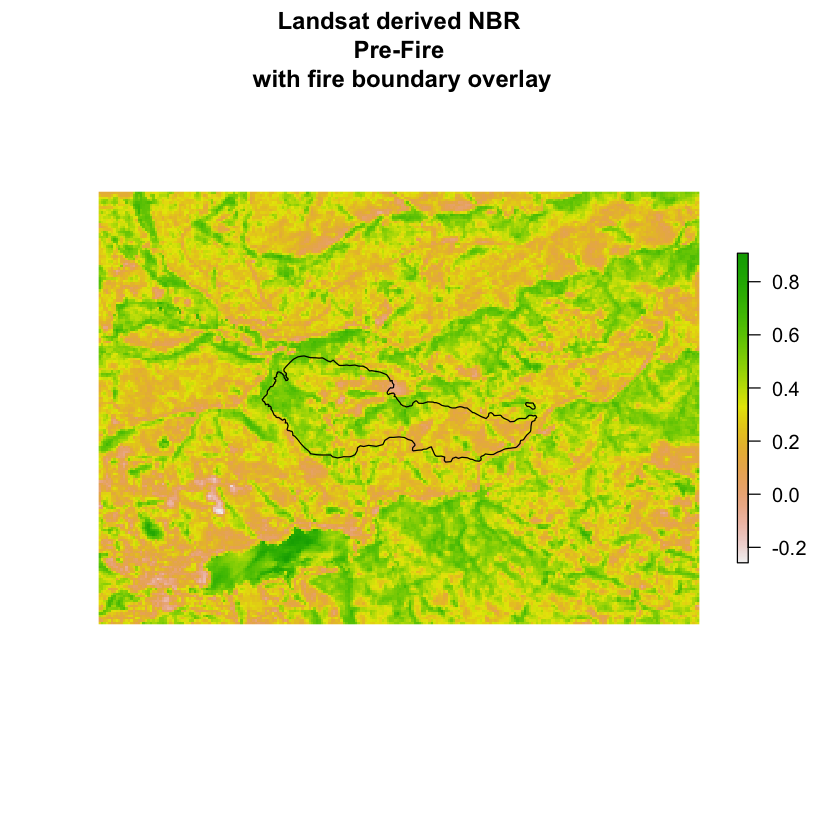
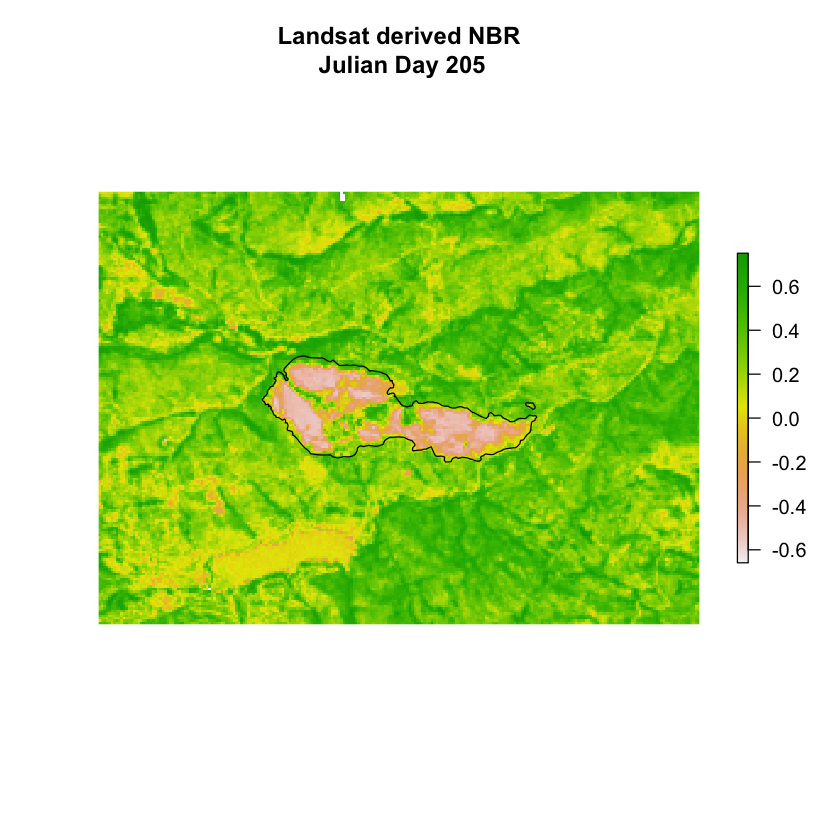
Normalized Burn Ratio (NBR)
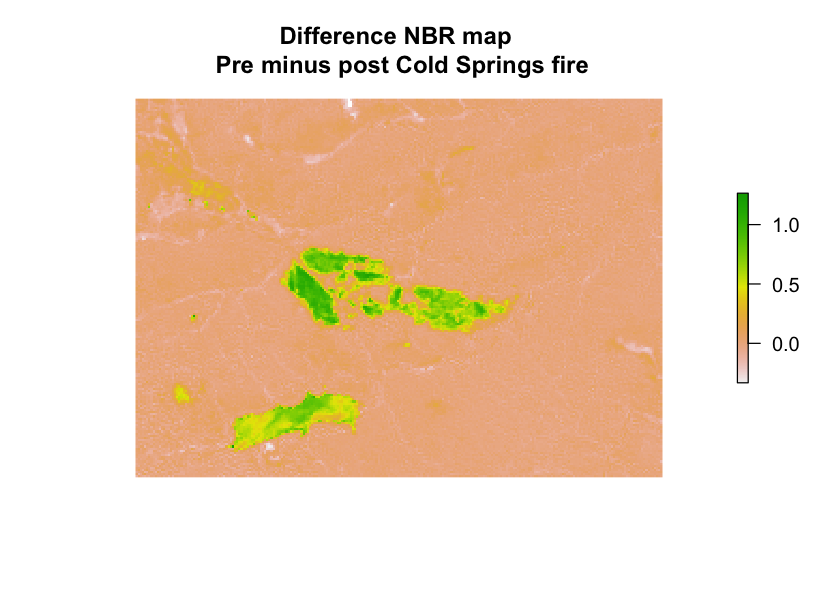
The normalized burn ratio (NBR) is another vegetation index that allows you to visualize burned areas to understand fire severity. To use NBR to understand wildfire, you can perform the calculation on a remotely sensed image taken prior to the fire and on another taken after, and then calculate the difference between the two.
This difference image is called a dNBR (difference NBR) image. The images below show an example of an dNBR image for the Cold Springs Fire. In this course, you will learn how to perform these calculations and create these images using Python.
Where to Find Remote Sensing Data
There are many different free and proprietary sources of remote sensing data. In this course, you will learn how to use the following types of satellite data to understand fire impacts:
Each one of these data sets have different spatial and temporal resolutions.
| Data Source | Spatial Resolution | Temporal Resolution | Spectral Resolution |
|---|---|---|---|
| NAIP | Typically 1m (only in US) | Every few years | 3-4 bands |
| MODIS | 250m, 500m, 1000m (depending on the band) | Daily, 8 day, 16 day, Monthly, Quarterly, Yearly (Depending on the product) | 36 bands |
| Landsat 8 | 30m | 16 days | 11 bands |
| Sentinel-2 | 10m, 20m, 60m (depending on the band) | 5 days | 12 bands |
Share on
Twitter Facebook Google+ LinkedIn
Leave a Comment