Lesson 6. Practice Opening and Plotting Landsat Data in Python Using Rasterio
Learning Objectives
After completing this lesson, you will be able to:
- Practice your skills using Landsat data in Python.
import os
from glob import glob

import matplotlib.pyplot as plt
import geopandas as gpd
import rioxarray as rxr
import xarray as xr
from shapely.geometry import mapping
import numpy as np
import numpy.ma as ma
import earthpy as et
import earthpy.spatial as es
import earthpy.plot as ep


# Download data and set working directory
data = et.data.get_data('cold-springs-fire')
os.chdir(os.path.join(et.io.HOME, 'earth-analytics', 'data'))
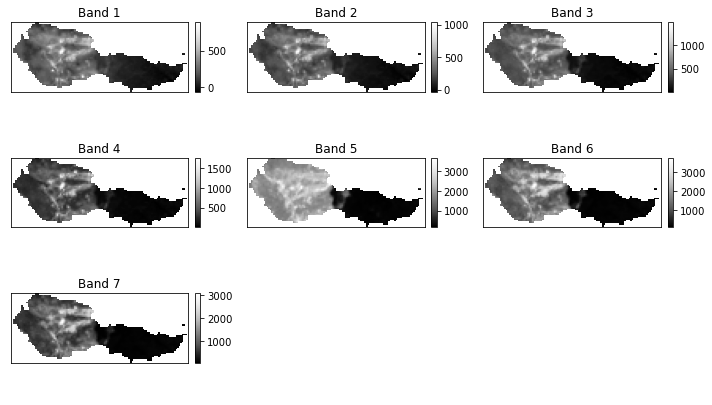
Challenge 1: Open And Crop Your Data
Above, you opened up the landsat scene in the directory: LC080340322016072301T1-SC20180214145802. This data covers an area which a file occured near Nederland, Colorado. For this challenge, you will work with data that was collected before the fire for the same area. Do the following:
- Crop all of the bands (tif files with the word “band” in them, in the
LC080340322016070701T1-SC20180214145604directory using xarrayconcat()and rioxarrayrio.clip(). - Make sure your fire boundary data is in the correct crs before clipping the array!
- Plot the data using
ep.plot_bands()
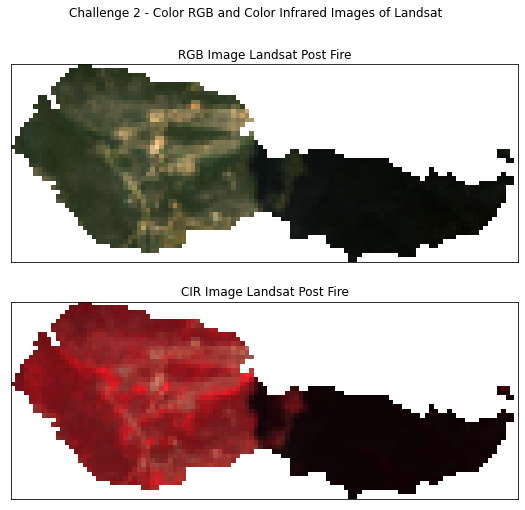
Challenge 2 (Optional): Plot CIR and RGB Images Using Landsat
In this lesson which introduces working with Landsat data in open source Python, you learn how to plot both a color RGB and Color Infrared (CIR) images using landsat data. Create a figure below that has:
- A color RGB image of the landsat data collected post fire
- A CIR image of the landsat data collected post fire.
HINT: You will need to set the correct band combinations for your plots to turn our properly. You will also have to mask out the nan values for your plot to work.
- For Regular color images use:
rgb=[3, 2, 1] - For color infrared use:
rgb=[4, 3, 2]
Share on
Twitter Facebook Google+ LinkedIn
Leave a Comment