Lesson 4. Customize Matplotlib Raster Maps in Python
Learning Objectives
- Customize a raster map in Python using matplotlib.
Customize Matplotlib Raster Plots
You often want to customize the way a raster is plotted in Python. In this lesson, you will learn how to create quantitative breaks to visually color sets of raster values. You will also learn how to create a custom labeled colorbar.
To begin, load all of the required libraries. Notice that you are loading Patch and ListedColormap from matplotlib.
import os
import matplotlib.pyplot as plt
from matplotlib.patches import Patch
from matplotlib.colors import ListedColormap
import matplotlib.colors as colors
import seaborn as sns
import numpy as np
import rioxarray as rxr
import earthpy as et
import earthpy.plot as ep

# Prettier plotting with seaborn
sns.set(font_scale=1.5, style="white")

# Import data
data = et.data.get_data("colorado-flood")

# Set working directory
os.chdir(os.path.join(et.io.HOME, 'earth-analytics', 'data'))
You will work with the canopy height model raster that you created in this week’s lessons. Below is the code to create that raster if you have not already created it.
# Open raster data
lidar_chm_path = os.path.join("colorado-flood",
                              "spatial",
                              "outputs",
                              "lidar_chm.tiff")

lidar_chm = rxr.open_rasterio(lidar_chm_path, masked=True).squeeze()
Plots Using Breaks
Sometimes assigning colors to specific value ranges in your data can help you better understand what is going on in the raster. For example you may chose to highlight just the talled pixels with a color that allows you to see how those pixels are distributed across the entire raster.
Maybe by doing this you will visually identify spatial patterns that you want to explore in more depth. To do this, you can create breaks in your CHM plot.
To begin, create a list of colors that you wish to use to color each bin of your raster.
Then assign each color to a bin using .BoundaryNorm.
# Define the colors you want
cmap = ListedColormap(["white", "tan", "springgreen", "darkgreen"])

# Define a normalization from values -> colors
norm = colors.BoundaryNorm([0, 2, 10, 20, 30], 5)
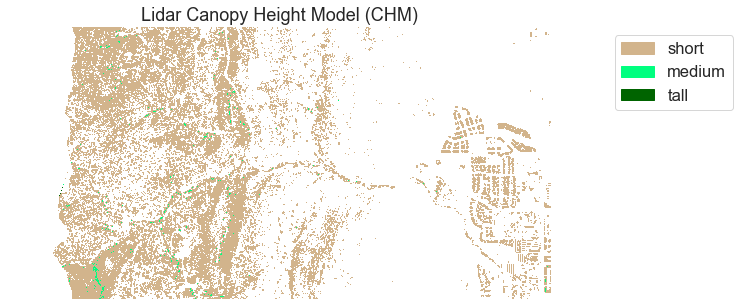
Once you have the bins and colors defined, ou can plot your data.
Below, the color map (cmap) is set to the listed colormap that you created above.
The data are then normalized or binned using the bins that you created.
Finally, you create a custom legend by defining labels and then create a patch or a square colored object for each color or range of values rendered in your raster plot.
fig, ax = plt.subplots(figsize=(10, 5))

chm_plot = ax.imshow(lidar_chm,
                     cmap=cmap,
                     norm=norm)

ax.set_title("Lidar Canopy Height Model (CHM)")

# Add a legend for labels
legend_labels = {"tan": "short",
                 "springgreen": "medium",
                 "darkgreen": "tall"}

patches = [Patch(color=color, label=label)
           for color, label in legend_labels.items()]

ax.legend(handles=patches,
          bbox_to_anchor=(1.35, 1),
          facecolor="white")

ax.set_axis_off()
plt.show()
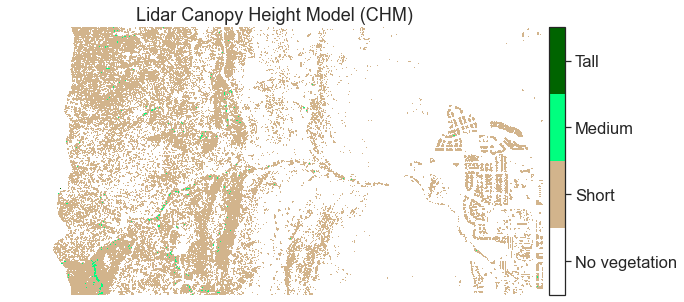
Colorbars With Custom Labels in Matplotlib
You can also modify the colorbar to the right so that each bin has a human-readable category.
fig, ax = plt.subplots(figsize=(10, 5))

chm_plot = ax.imshow(lidar_chm,
                     cmap=cmap,
                     norm=norm)

ax.set_title("Lidar Canopy Height Model (CHM)")

# Scale color bar to the height of the plot
cbar = ep.colorbar(chm_plot)

boundary_means = [np.mean([norm.boundaries[ii], norm.boundaries[ii - 1]])
                  for ii in range(1, len(norm.boundaries))]

category_names = ['No vegetation', 'Short', 'Medium', 'Tall']
cbar.set_ticks(boundary_means)
cbar.set_ticklabels(category_names)

ax.set_axis_off()
plt.show()
Share on
Twitter Facebook Google+ LinkedIn
Leave a Comment