Lesson 1. Introduction to Plotting in Python Using Matplotlib
Introduction to Plotting with Matplotlib - Scientists guide to plotting data in python textbook course module
Welcome to the first lesson in the Introduction to Plotting with Matplotlib module. Matplotlib is the most commonly used plotting library in Python. Learn how to get started with creating and customizing plots using matplotlib.Chapter One - Introduction to Plotting with Matplotlib
In this chapter, you will learn how to create and customize plots in Python using matplotlib, including how to create different types of plots and customize plot colors and labels.
Learning Objectives
After completing this chapter, you will be able to:
- Explain the matplotlib object-oriented approach to plotting.
- Use matplotlib to create scatter, line and bar plots.
- Customize the labels, colors and look of your matplotlib plot.
- Create figures with multiple plots.
- Save figure as an image file (e.g. .png format).
What You Need
Be sure that you have followed the instructions on Setting up Git, Bash, and Conda on your computer to install the tools for your operating system (Windows, Mac, Linux).
Be sure that you have completed the chapter on Jupyter Notebook.
Overview of Plotting with Matplotlib
Matplotlib is a Python plotting package that makes it simple to create two-dimensional plots from data stored in a variety of data structures including lists, numpy arrays, and pandas dataframes.
Matplotlib uses an object oriented approach to plotting. This means that plots can be built step-by-step by adding new elements to the plot.
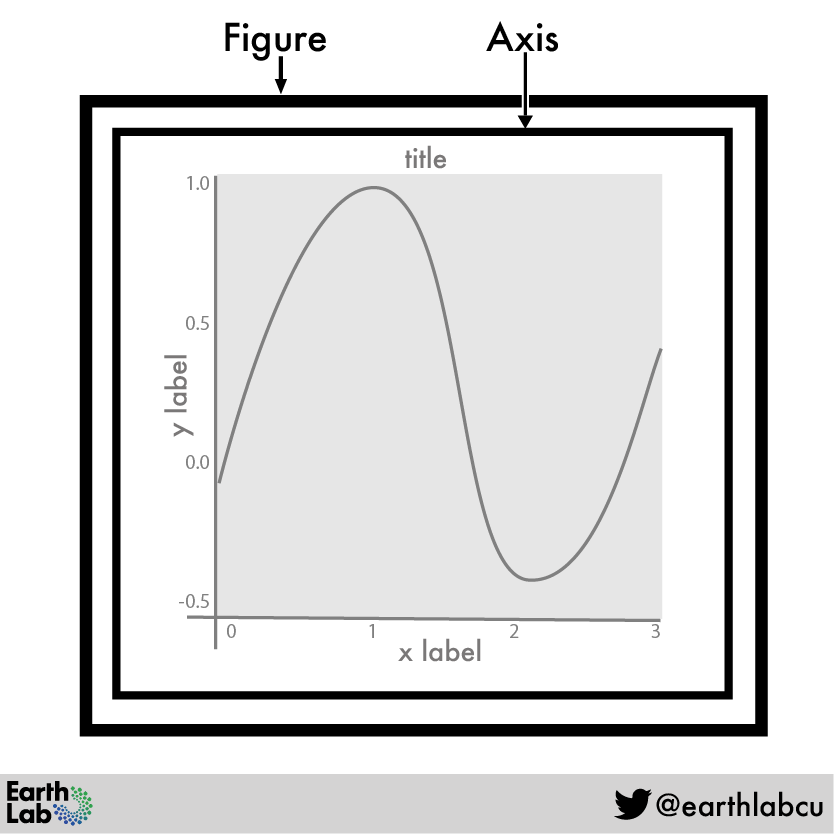
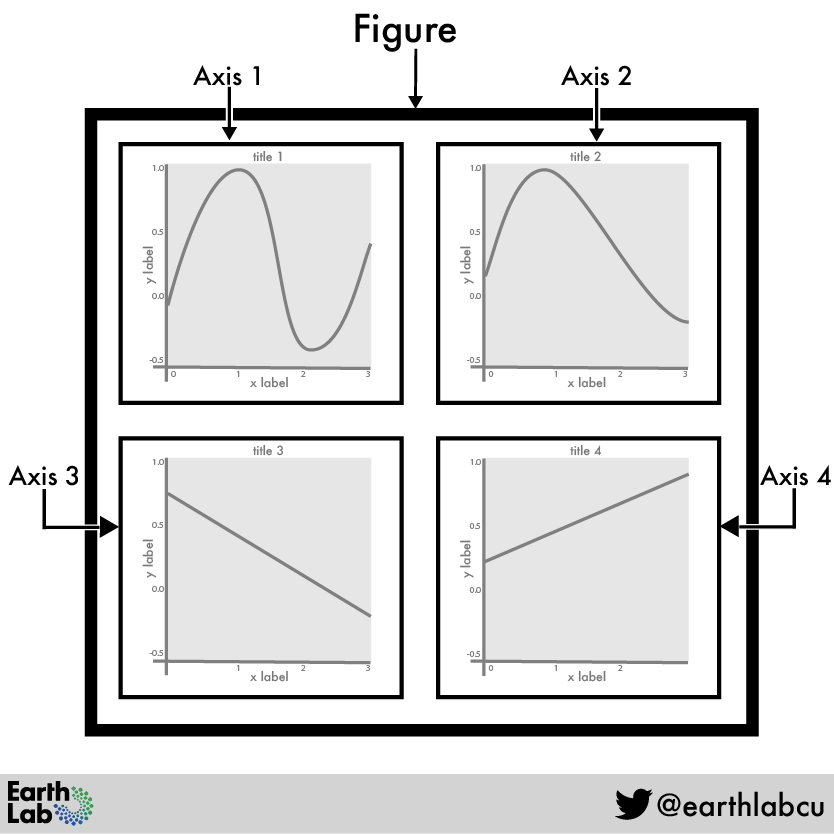
There are two primary objects associated with a matplotlib plot:
figureobject: the overall figure space that can contain one or more plots.axisobjects: the individual plots that are rendered within the figure.
You can think of the figure object as your plot canvas. You can think about the axis object as an individual plot.
A figure can hold one or more axis objects. This structure allows you to create figures with one or more plots on them.
While Matplotlib contains many modules that provide different plotting functionality, the most commonly used module is pyplot.
Pyplot provides methods that can be used to add different components to figure objects, including creating the individual plots as axis objects, also known as subplots.
The pyplot module is typically imported using the alias plt as demonstrated below.
# Import pyplot
import matplotlib.pyplot as plt
Create Plots Using Matplotlib
To create a plot using matplotlib’s object oriented approach, you first create the figure (which you can call fig) and at least one axis (which you can call ax) using the subplots() function from the pyplot module:
fig, ax = plt.subplots()
Notice that the fig and ax are created at the same time by setting them equal to the output of the pyplot.subplots() function. As no other arguments have been provided, the result is a figure with one plot that is empty but ready for data.
Data Tip: In the example above, fig and ax are variable names for the figure and axis objects. You can call these items whatever you want. For example, you might see f, ax or fig, axis1 used.
# Create figure and one plot (axis object)
fig, ax = plt.subplots()
Change Figure Size
You can change the size of your figure using the argument figsize to specify a width and height for your figure:
figsize = (width, height)
# Resize figure
fig, ax = plt.subplots(figsize = (10, 6))
Multi-plot Figures
Using matplotlib’s object-oriented approach makes it easier to include more than one plot in a figure by creating additional axis objects.
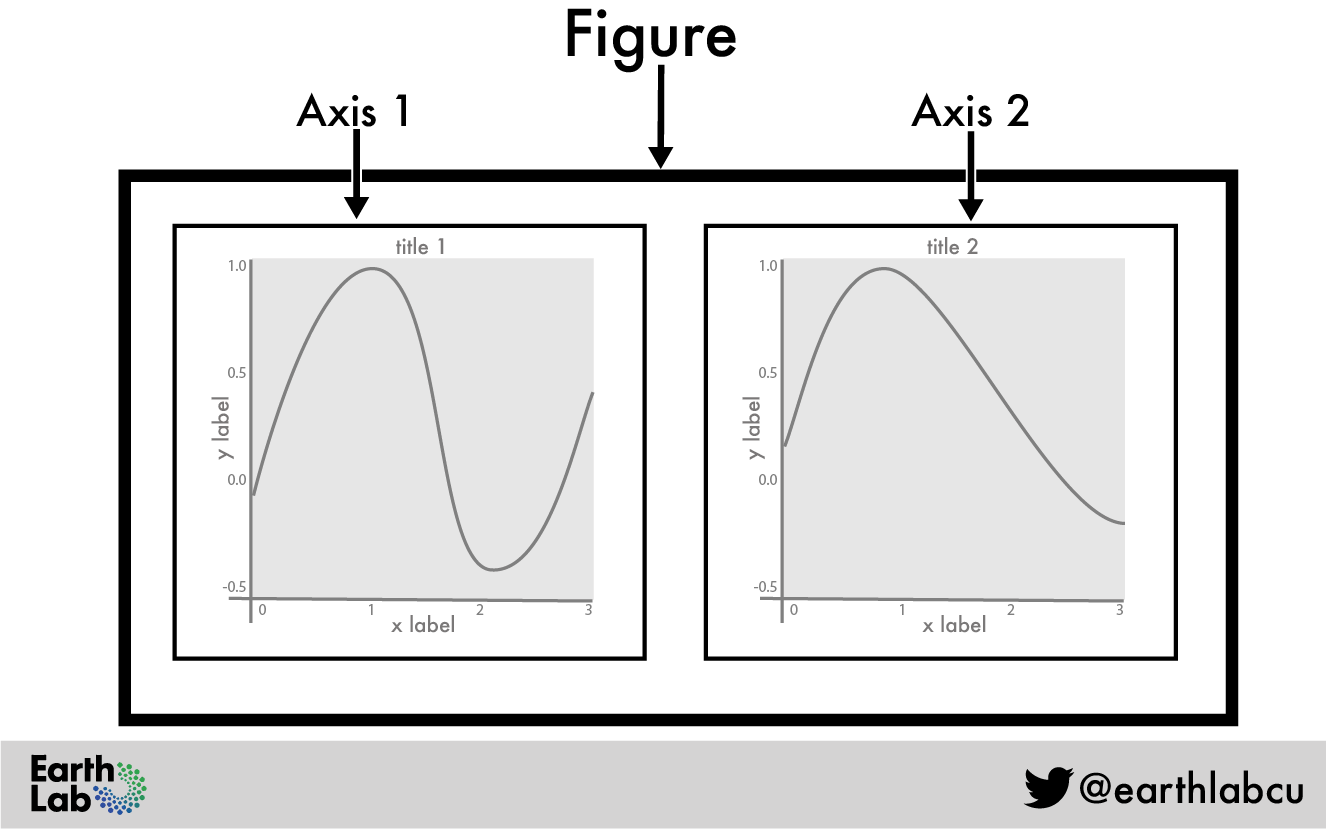
When adding more than one axis object, it is good practice to give them distinct names (such as ax1 and ax2), so you can easily work with each axis individually.
You will need to provide new arguments to plt.subplots for the layout of the figure: number of rows and columns:
plt.subplots(1, 2)
In this example, 1, 2 indicates that you want the plot layout to be 1 row across 2 columns.
# Figure with two plots
fig, (ax1, ax2) = plt.subplots(1, 2, figsize = (10, 6))
Conversely, 2, 1 indicates that you want the plot layout to be 2 rows across one column.
# Figure with two plots
fig, (ax1, ax2) = plt.subplots(2, 1, figsize = (10, 6))
Because you have defined figsize=(10, 6), the figure space remains the same size regardless of how many rows or columns you request.
You can play around with both the number of rows and columns as well as figsize to arrive at the look that you want.
# Figure with two plots
fig, (ax1, ax2) = plt.subplots(2, 1, figsize = (12, 12))
You can continue to add as many as axis objects as you need to create the overall layout of the desired figure and continue adjusting the figsize as needed.
# Figure with three plots
fig, (ax1, ax2, ax3) = plt.subplots(3, 1, figsize = (15, 15))
A key benefit of the matplotlib object oriented approach is that each axis is its own object and can be customized independently of the other plots in the figure.
You will learn how to take advantage of this capability to customize individual plots on the next page of this chapter.
Share on
Twitter Facebook Google+ LinkedIn
Leave a Comment