Lesson 2. Import CSV Files Into Pandas Dataframes
Learning Objectives
- Import tabular data from .csv files into pandas dataframes.
CSV Files of Tabular Data as Inputs to Pandas Dataframes
Recall that scientific data can come in a variety of file formats and types, including comma-separated values files (.csv), which use delimiters such as commas (or some other delimiter like tab spaces or semi-colons) to indicate separate values.
CSV files also support labeled names for the columns, referred to as headers. This means that CSV files can easily support multiple columns of related data, and thus, are very useful for collecting and organizing datasets across multiple locations and/or timeframes.
As you learned previously in this chapter, you can manually define pandas dataframes as needed using the pandas.DataFrame() function. However, when working with larger datasets, you will want to import data directly into pandas dataframes from .csv files.
Get Data to Import Into Pandas Dataframes
To import data into pandas dataframes, you will need to import the pandas package, and you will use the earthpy package to download the data files from the Earth Lab data repository on Figshare.com.
# Import packages
import os

import matplotlib.pyplot as plt
import pandas as pd
import earthpy as et
Recall from the previous chapter on numpy arrays that you can use the function data.get_data() from the earthpy package (which you imported with the alias et) to download data from online sources such as the Figshare.com data repository. To use the function et.data.get_data(), you need to provide a parameter value for the url, which you define by providing a text string of the URL to the dataset.
Begin by downloading a .csv file for average monthly precipitation for Boulder, CO from the following URL:
https://ndownloader.figshare.com/files/12710618
# URL for .csv with avg monthly precip data
avg_monthly_precip_url = "https://ndownloader.figshare.com/files/12710618"

# Download file from URL
et.data.get_data(url=avg_monthly_precip_url)
Downloading from https://ndownloader.figshare.com/files/12710618
'/root/earth-analytics/data/earthpy-downloads/avg-precip-months-seasons.csv'
# Set working directory to earth-analytics
os.chdir(os.path.join(et.io.HOME,
                      "earth-analytics",
                      "data"))
Import Tabular Data from CSV Files into Pandas Dataframes
Using the read_csv() function from the pandas package, you can import tabular data from CSV files into pandas dataframe by specifying a parameter value for the file name (e.g. pd.read_csv("filename.csv")). Remember that you gave pandas an alias (pd), so you will use pd to call pandas functions.
# Import data from .csv file
fname = os.path.join("earthpy-downloads",
                     "avg-precip-months-seasons.csv")

avg_monthly_precip = pd.read_csv(fname)

avg_monthly_precip
| months | precip | seasons | |
|---|---|---|---|
| 0 | Jan | 0.70 | Winter |
| 1 | Feb | 0.75 | Winter |
| 2 | Mar | 1.85 | Spring |
| 3 | Apr | 2.93 | Spring |
| 4 | May | 3.05 | Spring |
| 5 | June | 2.02 | Summer |
| 6 | July | 1.93 | Summer |
| 7 | Aug | 1.62 | Summer |
| 8 | Sept | 1.84 | Fall |
| 9 | Oct | 1.31 | Fall |
| 10 | Nov | 1.39 | Fall |
| 11 | Dec | 0.84 | Winter |
As you can see, the months and precip data can exist together in the same pandas dataframe, which differs from numpy arrays. You can see that there is also a column for seasons containing text strings.
Once again, you can also see that the indexing still begins with [0], as it does for Python lists and numpy arrays, and that you did not have to use the print() function to see a nicely formatted version of the pandas dataframe.
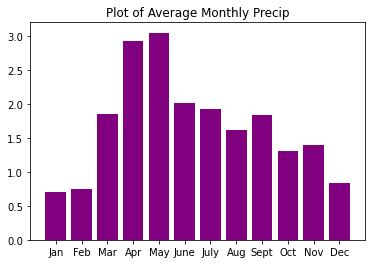
Challenge 1: Plot a DataFrame
In the previous lesson you learned how to plot a pandas dataframe using matplotlib.
Test your your skills by plotting the data frame that you opened above.
Instead of using ax.plot(), use ax.bar() to create your plot.
HINT: to make this plot work, you will have to specify the x axis variable and then height instead of y. Your code will look something like this:
ax.bar(x=dataframe.column,
       height=dataframe.column)
You now know how to import data from .csv files into pandas dataframes, which will come in very handy as you begin to work with scientific data. On the next pages of this chapter, you will learn how to work with pandas dataframes to run calculations, summarize data, and more.
Share on
Twitter Facebook Google+ LinkedIn
Leave a Comment