Lesson 4. Handle Missing Data in R Clean coding tidyverse intro
Learning objectives
At the end of this activity, you will be able to:
- Understand why it is important to make note of missing data values.
- Be able to define what a NA value is in
Rand how it is used in a vector.
What you need
Follow the setup instructions here:
In the previous lesson you attempted to plot the first file’s worth of data by time. However, the plot did you turn out as planned. There were at least two values that likely represent missing data values:
missingand999.99
In this lesson, you will learn how to handle missing data values in R using readr and some basic data exploration approaches.
Missing Data Values
Sometimes, your data are missing values. Imagine a spreadsheet in Microsoft Excel with cells that are blank. If the cells are blank, you don’t know for sure whether those data weren’t collected, or someone forgot to fill them in. To indicate that data are missing (not by mistake) you can put a value in those cells that represents no data.
The R programming language uses NA to represent missing data values.
Lucky for us, readr makes it easy to deal with missing data values too. To account for these, we use the argument:
na = "value_to_change_to_na_here"
You can also send na a vector of missing data values, like this: na = c("value1", "value2")
# load libraries
library(readr)
library(ggplot2)
library(dplyr)
Let’s go through our workflow again but this time account for missing values. First, let’s have a look at the unique values contained in our HPCP column
# import data using readr
all_paths <- read_csv("data/data_urls.csv")
# grab first url from the file
first_csv <- all_paths$url[1]

# open data
year_one <- read_csv(first_csv)
# view unique vales in HPCP field
unique(year_one$HPCP)
## [1] "0"       "0.2"     "0.1"     "999.99"  "missing" "0.3"     "0.9"
## [8] "0.5"
Next, we can create a vector of missing data values. We can see that we have 999.99 and missing as possible NA values.
# define all missing data values in a vector
na_values <- c("missing", "999.99")

# use the na argument to read in the csv
year_one <- read_csv(first_csv,
                     na = na_values)
unique(year_one$HPCP)
## [1] 0.0 0.2 0.1  NA 0.3 0.9 0.5
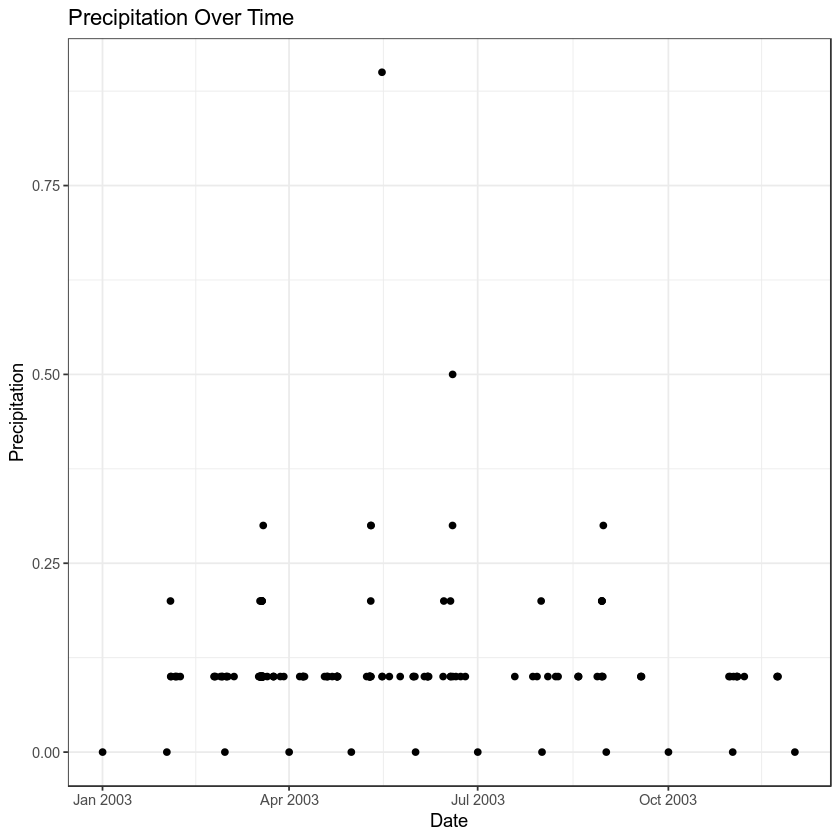
Once you have specified possible missing data values, try to plot again.
year_one %>%
  ggplot(aes(x = DATE, y = HPCP)) +
  geom_point() +
  theme_bw() +
  labs(x = "Date",
       y = "Precipitation",
       title = "Precipitation Over Time")

Note that when ggplot encounters missing data values, it tells you with a warning message:
Warning message:
Removed 3 rows containing missing values (geom_point).
On Your Own (OYO)
The mutate() function allows you to add a new column to a data.frame. And the month() function in the lubridate package, will convert a datetime object to a month value (1-12) as follows
mutate(the_month = month(date_field_here))
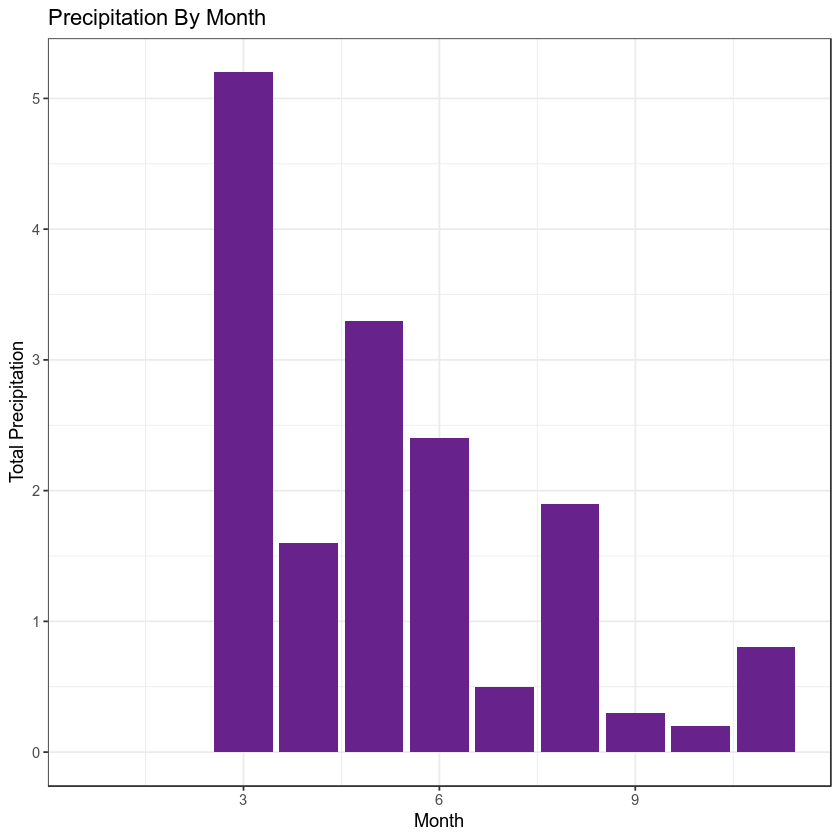
Create a plot that summarizes total precipitation by month for the first csv file that we have worked with through this lesson. Use everything that you have learned so far to do this.
Your final plot should look like the one below:

HINTS:
The bar plot was created using the following ggplot elements:
geom_bar(stat = "identity", fill = "darkorchid4") + theme_bw()
Additional resources
You may find the materials below useful as an overview of what we cover during this workshop:
Share on
Twitter Facebook Google+ LinkedIn
Leave a Comment