Lesson 3. Create Data Workflows with Loops
Learning Objectives
After completing this chapter, you will be able to:
- Iterate through multiple directories to access data within.
- Nest loops in each other to run more complicated loops.
- Use for loops to combine multiple datasets into one Pandas
DataFrame.
Build a Data Workflow
Often, the data that you need for your workflow is messy and sometimes
difficult to access. It can be spread out over multiple files in many
directories. Manually processing data in multiple files and directories
manually is time consuming. It can be much easier to automate the process in
Python with for loops! This lesson will cover using loops to automate
data workflows where you have many different files that you need to work with.
import os
from glob import glob
import matplotlib.pyplot as plt
import pandas as pd
import earthpy as et

# Download data on average monthly temp for two California sites
file_url = "https://ndownloader.figshare.com/files/21894528"
data_path = et.data.get_data(url=file_url)
data_path

# Set working directory to earth-analytics
os.chdir(os.path.join(et.io.HOME,
                      "earth-analytics",
                      "data",
                      "earthpy-downloads"))
Downloading from https://ndownloader.figshare.com/files/21894528
Extracted output to /root/earth-analytics/data/earthpy-downloads/avg-monthly-temp-fahr
# List directories for the data
os.listdir(data_path)
['Sonoma', 'San-Diego']
The data downloaded above contain temperature data for two cities in California, USA: Sonoma and San Diego. Within each directory you will find temperature data for the year stored in individual .csv files. Like this:
Sonoma-1999-temp.csv
Sonoma-2000-temp.csv
Sonoma-2001-temp.csv
Your analysis goal is to create a plot of temperature across all years that you have data for in both locations. To create this plot, you will need to:
- open each file
- combine the data for each year into a single dataframe
- add an attribute that specifies the location and year to the
data.frame
The above steps will allow you to summarize the plot the data.
Explore Your Data Using Loops
It’s normal to open and look at your directory structure after you download new data.
You can, however, also explore the data using glob to list directories and files
within each directory. To begin, create a list of all the directories in your
new download directory. If you remember from Chapter 12 of this textbook, you can use glob to create a list of files that match
certain criteria. You can then iterate through those lists with for loops to
perform an operation on each file.
Here, you create a list using glob of all of the folders in the data you
downloaded, and then iterate through that list with a for loop to print
out the name of each folder within the main directory.
# Print all dirs found by glob
data_dirs = os.path.join(data_path, "*")
all_dirs = glob(data_dirs)

for a_dir in all_dirs:
    print(a_dir)
/root/earth-analytics/data/earthpy-downloads/avg-monthly-temp-fahr/Sonoma
/root/earth-analytics/data/earthpy-downloads/avg-monthly-temp-fahr/San-Diego
Use glob Inside a for Loop
The folders printed out above are interesting, but they are not the files you
want to work on. The files are another directory down, stored within the folders
printed above. To access these files, you can use glob once again. Inside the
for loop, you can use glob to create a list of all of the files within each
folder in the original list.
Below you can see two different lists printed, one with all of the files stored in
the San-Diego folder, and one with all of the files stored in the Sonoma folder.
# Create lists inside a for loop
for a_dir in all_dirs:
    all_files = os.path.join(a_dir, "*")
    print(glob(all_files))
['/root/earth-analytics/data/earthpy-downloads/avg-monthly-temp-fahr/Sonoma/Sonoma-2001-temp.csv', '/root/earth-analytics/data/earthpy-downloads/avg-monthly-temp-fahr/Sonoma/Sonoma-2002-temp.csv', '/root/earth-analytics/data/earthpy-downloads/avg-monthly-temp-fahr/Sonoma/Sonoma-2003-temp.csv', '/root/earth-analytics/data/earthpy-downloads/avg-monthly-temp-fahr/Sonoma/Sonoma-2000-temp.csv', '/root/earth-analytics/data/earthpy-downloads/avg-monthly-temp-fahr/Sonoma/Sonoma-1999-temp.csv']
['/root/earth-analytics/data/earthpy-downloads/avg-monthly-temp-fahr/San-Diego/San-Diego-2002-temp.csv', '/root/earth-analytics/data/earthpy-downloads/avg-monthly-temp-fahr/San-Diego/San-Diego-2000-temp.csv', '/root/earth-analytics/data/earthpy-downloads/avg-monthly-temp-fahr/San-Diego/San-Diego-1999-temp.csv', '/root/earth-analytics/data/earthpy-downloads/avg-monthly-temp-fahr/San-Diego/San-Diego-2003-temp.csv', '/root/earth-analytics/data/earthpy-downloads/avg-monthly-temp-fahr/San-Diego/San-Diego-2001-temp.csv']
Nesting for Loops
Now that you’ve created another list inside of a for loop, you can loop
through that list too! Below, you create the list of files inside each directory
with glob, and then you loop through that list to print out each individual file.
Nesting for loops is a powerful tool, but can also be computationally expensive.
Each time the outer loop executes one cycle, the for loop that’s nested inside must
complete it’s entire loop before the outer loop executes it’s next cycle. You can nest
as many for loops as you want, but it’s good to keep this in mind. The more for
loops that are nested, the longer each cycle of the outer for loop will take.
# Nesting for loops
for a_dir in all_dirs:
    dir_path = os.path.join(a_dir, "*")
    all_file_paths = (glob(dir_path))
    # Create a nested loop which loops through each directory
    for a_file_path in all_file_paths:
        print(a_file_path)
/root/earth-analytics/data/earthpy-downloads/avg-monthly-temp-fahr/Sonoma/Sonoma-2001-temp.csv
/root/earth-analytics/data/earthpy-downloads/avg-monthly-temp-fahr/Sonoma/Sonoma-2002-temp.csv
/root/earth-analytics/data/earthpy-downloads/avg-monthly-temp-fahr/Sonoma/Sonoma-2003-temp.csv
/root/earth-analytics/data/earthpy-downloads/avg-monthly-temp-fahr/Sonoma/Sonoma-2000-temp.csv
/root/earth-analytics/data/earthpy-downloads/avg-monthly-temp-fahr/Sonoma/Sonoma-1999-temp.csv
/root/earth-analytics/data/earthpy-downloads/avg-monthly-temp-fahr/San-Diego/San-Diego-2002-temp.csv
/root/earth-analytics/data/earthpy-downloads/avg-monthly-temp-fahr/San-Diego/San-Diego-2000-temp.csv
/root/earth-analytics/data/earthpy-downloads/avg-monthly-temp-fahr/San-Diego/San-Diego-1999-temp.csv
/root/earth-analytics/data/earthpy-downloads/avg-monthly-temp-fahr/San-Diego/San-Diego-2003-temp.csv
/root/earth-analytics/data/earthpy-downloads/avg-monthly-temp-fahr/San-Diego/San-Diego-2001-temp.csv
Data Tip: Assigning Variables in for Loops
When assigning variables in Python, overwriting a variable with new data
can be useful to update values and make your code more legible. This can be useful
in for loops too, but can easily be done by accident as well. Below, you see that
for every file in the two folders that contain your data, the line pd.read_csv()
is run, and assigned to the variable data. However, with each new cycle of the for
loop, that variable is getting reassigned to a new file’s data.
You can see that even though you opened up and read every single file into pandas,
the only data stored in the data variable is from the last file that was read, which
happens to be the 2003 data from the Sonoma folder.
To avoid this data being overwritten every cycle, a common work around is to create a
list outside of the for loop, and append all of the values into that list. That way
the data variable from each cycle will be stored in the list with the data from that
cycle stored in it, preventing it from being overwritten.
for a_dir in all_dirs:
    dir_path = os.path.join(a_dir, "*")
    all_file_paths = (glob(dir_path))
    # Create a nested loop which loops through each directory
    for a_file_path in all_file_paths:
        print(a_file_path)
        # Read the file into a pandas dataframe and assign it to a variable
        temp_data_df = pd.read_csv(a_file_path)
temp_data_df
/root/earth-analytics/data/earthpy-downloads/avg-monthly-temp-fahr/Sonoma/Sonoma-2001-temp.csv
/root/earth-analytics/data/earthpy-downloads/avg-monthly-temp-fahr/Sonoma/Sonoma-2002-temp.csv
/root/earth-analytics/data/earthpy-downloads/avg-monthly-temp-fahr/Sonoma/Sonoma-2003-temp.csv
/root/earth-analytics/data/earthpy-downloads/avg-monthly-temp-fahr/Sonoma/Sonoma-2000-temp.csv
/root/earth-analytics/data/earthpy-downloads/avg-monthly-temp-fahr/Sonoma/Sonoma-1999-temp.csv
/root/earth-analytics/data/earthpy-downloads/avg-monthly-temp-fahr/San-Diego/San-Diego-2002-temp.csv
/root/earth-analytics/data/earthpy-downloads/avg-monthly-temp-fahr/San-Diego/San-Diego-2000-temp.csv
/root/earth-analytics/data/earthpy-downloads/avg-monthly-temp-fahr/San-Diego/San-Diego-1999-temp.csv
/root/earth-analytics/data/earthpy-downloads/avg-monthly-temp-fahr/San-Diego/San-Diego-2003-temp.csv
/root/earth-analytics/data/earthpy-downloads/avg-monthly-temp-fahr/San-Diego/San-Diego-2001-temp.csv
| Year | January | February | March | April | May | June | July | August | September | October | November | December | |
|---|---|---|---|---|---|---|---|---|---|---|---|---|---|
| 0 | 2001 | 62.2 | 61.7 | 63.7 | 63.6 | 67.5 | 72 | 73 | 73.5 | 73.2 | 71.1 | 66.9 | 63.3 |
Combining Pandas Datasets in a List
pandas has a lot of functionality that makes modifying large amounts of
data much easier. One such function is the concat function, which can be
used to combine multiple pandas DataFrames stored in a list into one
DataFrame. You can combine this functionality with a list of DataFrames
created and added to a list in a for loop, and create a final DataFrame
with all of the data stored in the directory structure.
# Create a list outside of the for loop to store data
all_df = []

for a_dir in all_dirs:
    dir_path = os.path.join(a_dir, "*")
    all_file_paths = (glob(dir_path))
    for a_file_path in all_file_paths:
        temp_data_df = pd.read_csv(a_file_path)
        # Append the data to the list you made to prevent it from being overwritten
        all_df.append(temp_data_df)

# Combine all the dataframes stored in the all_df list into one pandas dataframe
pd.concat(all_df)
| Year | January | February | March | April | May | June | July | August | September | October | November | December | |
|---|---|---|---|---|---|---|---|---|---|---|---|---|---|
| 0 | 2001 | 56.5 | 58.4 | 68.0 | 66.7 | 83.1 | 86.1 | 81.2 | 85.3 | 81.0 | 78.4 | 64.0 | 55.6 |
| 0 | 2002 | 55.8 | 62.9 | 63.5 | 66.9 | 74.5 | 84.2 | 82.8 | 82.1 | 84.5 | 75.7 | 67.6 | 57.4 |
| 0 | 2003 | 58.9 | 61.8 | 66.4 | 61.5 | 74.2 | 81.1 | 87.0 | 83.5 | 85.0 | 82.7 | 61.0 | 56.4 |
| 0 | 2000 | 56.8 | 58.0 | 64.8 | 69.5 | 75.0 | 79.5 | 81.4 | 83.7 | 83.4 | 71.8 | 60.7 | 58.5 |
| 0 | 1999 | 56.1 | 56.6 | 58.7 | 68.3 | 72.7 | 80.6 | 80.9 | 82.9 | 81.3 | 79.1 | 64.2 | 61.5 |
| 0 | 2002 | 63.0 | 66.2 | 63.6 | 63.7 | 66.1 | 68.7 | 71.8 | 73.4 | 75.5 | 68.4 | 71.4 | 63.7 |
| 0 | 2000 | 65.8 | 65.3 | 63.7 | 67.7 | 69.1 | 72.4 | 73.5 | 76.3 | 75.5 | 69.5 | 66.0 | 66.9 |
| 0 | 1999 | 65.2 | 64.9 | 63.6 | 64.6 | 64.4 | 66.9 | 72.7 | 72.7 | 71.4 | 77.7 | 67.4 | 67.6 |
| 0 | 2003 | 71.4 | 64.6 | 66.5 | 65.2 | 66.9 | 67.4 | 74.3 | 77.5 | 74.0 | 73.1 | 67.4 | 64.6 |
| 0 | 2001 | 62.2 | 61.7 | 63.7 | 63.6 | 67.5 | 72.0 | 73.0 | 73.5 | 73.2 | 71.1 | 66.9 | 63.3 |
Extracting Data from Pathnames
Often times when data is stored in many directories, the name of the folder that the data is stored in can have useful information. Some examples of this include:
- The date the data was collected
- The location where the data was collected
- Physical attributes of the data
- The resolution of the data
There are countless other examples of data that can be stored in a file pathname. Because of this, it can be useful to add data from a pathname to your data.
In this example, the two folders that store all of the files contain useful
information in the folder names. Specifically, the names, San-Diego and Sonoma,
are indicative of where the data was collected. You can add this information to a new
column in the pandas DataFrames you are creating.
Data Tip: Extracting Values from Pathnames
You can extract information from a path name in many ways.
In this exercise, we use os.path.basename() to get our information, but
that is not always the best way to collect information from a path. This wouldn’t
work if, for example, the infomation you wanted from a path wasn’t last folder name
in your pathname. For more ways to extract information from a path, see
this lesson modifying paths with glob and os.
You can extract the last folder name in your pathname by using os.path.basename().
This function will grab the last folder name in a pathname and return
it as a string.
# Get the basename from a pathname

basename = os.path.basename(all_dirs[0])

print("The pathname without running os.path.basename():\n" + all_dirs[0])
print("\nThe infromation extracted from the pathname by os.path.basename():\n" + basename)
The pathname without running os.path.basename():
/root/earth-analytics/data/earthpy-downloads/avg-monthly-temp-fahr/Sonoma

The infromation extracted from the pathname by os.path.basename():
Sonoma
# Read in filenames without modifying the pathnames

all_df = []
for a_dir in all_dirs:
    dir_path = os.path.join(a_dir, "*")
    all_file_paths = (glob(dir_path))
    for a_file_path in all_file_paths:
        temp_data_df = pd.read_csv(a_file_path)
        # Reading the pathname from each directory into the dataframe.
        # Notice how it reads in the entire pathname.
        temp_data_df["location"] = a_dir
        all_df.append(temp_data_df)

pd.concat(all_df)
| Year | January | February | March | April | May | June | July | August | September | October | November | December | location | |
|---|---|---|---|---|---|---|---|---|---|---|---|---|---|---|
| 0 | 2001 | 56.5 | 58.4 | 68.0 | 66.7 | 83.1 | 86.1 | 81.2 | 85.3 | 81.0 | 78.4 | 64.0 | 55.6 | /root/earth-analytics/data/earthpy-downloads/a... |
| 0 | 2002 | 55.8 | 62.9 | 63.5 | 66.9 | 74.5 | 84.2 | 82.8 | 82.1 | 84.5 | 75.7 | 67.6 | 57.4 | /root/earth-analytics/data/earthpy-downloads/a... |
| 0 | 2003 | 58.9 | 61.8 | 66.4 | 61.5 | 74.2 | 81.1 | 87.0 | 83.5 | 85.0 | 82.7 | 61.0 | 56.4 | /root/earth-analytics/data/earthpy-downloads/a... |
| 0 | 2000 | 56.8 | 58.0 | 64.8 | 69.5 | 75.0 | 79.5 | 81.4 | 83.7 | 83.4 | 71.8 | 60.7 | 58.5 | /root/earth-analytics/data/earthpy-downloads/a... |
| 0 | 1999 | 56.1 | 56.6 | 58.7 | 68.3 | 72.7 | 80.6 | 80.9 | 82.9 | 81.3 | 79.1 | 64.2 | 61.5 | /root/earth-analytics/data/earthpy-downloads/a... |
| 0 | 2002 | 63.0 | 66.2 | 63.6 | 63.7 | 66.1 | 68.7 | 71.8 | 73.4 | 75.5 | 68.4 | 71.4 | 63.7 | /root/earth-analytics/data/earthpy-downloads/a... |
| 0 | 2000 | 65.8 | 65.3 | 63.7 | 67.7 | 69.1 | 72.4 | 73.5 | 76.3 | 75.5 | 69.5 | 66.0 | 66.9 | /root/earth-analytics/data/earthpy-downloads/a... |
| 0 | 1999 | 65.2 | 64.9 | 63.6 | 64.6 | 64.4 | 66.9 | 72.7 | 72.7 | 71.4 | 77.7 | 67.4 | 67.6 | /root/earth-analytics/data/earthpy-downloads/a... |
| 0 | 2003 | 71.4 | 64.6 | 66.5 | 65.2 | 66.9 | 67.4 | 74.3 | 77.5 | 74.0 | 73.1 | 67.4 | 64.6 | /root/earth-analytics/data/earthpy-downloads/a... |
| 0 | 2001 | 62.2 | 61.7 | 63.7 | 63.6 | 67.5 | 72.0 | 73.0 | 73.5 | 73.2 | 71.1 | 66.9 | 63.3 | /root/earth-analytics/data/earthpy-downloads/a... |
# Read in filenames using os to modify the pathnames

all_df = []
for a_dir in all_dirs:
    dir_path = os.path.join(a_dir, "*")
    all_file_paths = (glob(dir_path))
    for a_file_path in all_file_paths:
        temp_data_df = pd.read_csv(a_file_path)
        # Read the pathname from each directory into the dataframe.
        # Notice how it reads just the last folder name into the column now.
        temp_data_df["location"] = os.path.basename(a_dir)
        all_df.append(temp_data_df)

all_data = pd.concat(all_df)
all_data
| Year | January | February | March | April | May | June | July | August | September | October | November | December | location | |
|---|---|---|---|---|---|---|---|---|---|---|---|---|---|---|
| 0 | 2001 | 56.5 | 58.4 | 68.0 | 66.7 | 83.1 | 86.1 | 81.2 | 85.3 | 81.0 | 78.4 | 64.0 | 55.6 | Sonoma |
| 0 | 2002 | 55.8 | 62.9 | 63.5 | 66.9 | 74.5 | 84.2 | 82.8 | 82.1 | 84.5 | 75.7 | 67.6 | 57.4 | Sonoma |
| 0 | 2003 | 58.9 | 61.8 | 66.4 | 61.5 | 74.2 | 81.1 | 87.0 | 83.5 | 85.0 | 82.7 | 61.0 | 56.4 | Sonoma |
| 0 | 2000 | 56.8 | 58.0 | 64.8 | 69.5 | 75.0 | 79.5 | 81.4 | 83.7 | 83.4 | 71.8 | 60.7 | 58.5 | Sonoma |
| 0 | 1999 | 56.1 | 56.6 | 58.7 | 68.3 | 72.7 | 80.6 | 80.9 | 82.9 | 81.3 | 79.1 | 64.2 | 61.5 | Sonoma |
| 0 | 2002 | 63.0 | 66.2 | 63.6 | 63.7 | 66.1 | 68.7 | 71.8 | 73.4 | 75.5 | 68.4 | 71.4 | 63.7 | San-Diego |
| 0 | 2000 | 65.8 | 65.3 | 63.7 | 67.7 | 69.1 | 72.4 | 73.5 | 76.3 | 75.5 | 69.5 | 66.0 | 66.9 | San-Diego |
| 0 | 1999 | 65.2 | 64.9 | 63.6 | 64.6 | 64.4 | 66.9 | 72.7 | 72.7 | 71.4 | 77.7 | 67.4 | 67.6 | San-Diego |
| 0 | 2003 | 71.4 | 64.6 | 66.5 | 65.2 | 66.9 | 67.4 | 74.3 | 77.5 | 74.0 | 73.1 | 67.4 | 64.6 | San-Diego |
| 0 | 2001 | 62.2 | 61.7 | 63.7 | 63.6 | 67.5 | 72.0 | 73.0 | 73.5 | 73.2 | 71.1 | 66.9 | 63.3 | San-Diego |
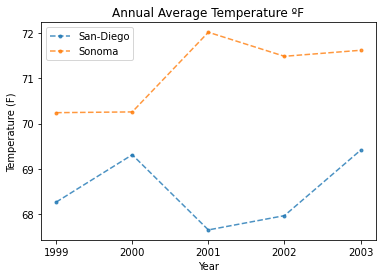
Plot Your Temperature Data
With the new column that specifies where the data was collected, you can use
the pandas groupby function to plot a chart for each location! The groupby
function will create a new plot for each unique entry in a column. Since there are
two locations in the location column, you can produce two graphs, one for each location.
Below, you can create a new column that is the mean of all of the monthly readings for
the average temperature in each location. With that column, you can plot the average
annual temperature of each location by year using the groupby function.
# Creating a dataframe that is just the columns for temperature from each month.
just_monthly_data_df = all_data.loc[:, "January":"December"]

# Get the average of each row in that dataframe and assigning the output to a new column in the original dataframe
all_data['annual_average_temp'] = just_monthly_data_df.mean(axis=1)
all_data
| Year | January | February | March | April | May | June | July | August | September | October | November | December | location | annual_average_temp | |
|---|---|---|---|---|---|---|---|---|---|---|---|---|---|---|---|
| 0 | 2001 | 56.5 | 58.4 | 68.0 | 66.7 | 83.1 | 86.1 | 81.2 | 85.3 | 81.0 | 78.4 | 64.0 | 55.6 | Sonoma | 72.025000 |
| 0 | 2002 | 55.8 | 62.9 | 63.5 | 66.9 | 74.5 | 84.2 | 82.8 | 82.1 | 84.5 | 75.7 | 67.6 | 57.4 | Sonoma | 71.491667 |
| 0 | 2003 | 58.9 | 61.8 | 66.4 | 61.5 | 74.2 | 81.1 | 87.0 | 83.5 | 85.0 | 82.7 | 61.0 | 56.4 | Sonoma | 71.625000 |
| 0 | 2000 | 56.8 | 58.0 | 64.8 | 69.5 | 75.0 | 79.5 | 81.4 | 83.7 | 83.4 | 71.8 | 60.7 | 58.5 | Sonoma | 70.258333 |
| 0 | 1999 | 56.1 | 56.6 | 58.7 | 68.3 | 72.7 | 80.6 | 80.9 | 82.9 | 81.3 | 79.1 | 64.2 | 61.5 | Sonoma | 70.241667 |
| 0 | 2002 | 63.0 | 66.2 | 63.6 | 63.7 | 66.1 | 68.7 | 71.8 | 73.4 | 75.5 | 68.4 | 71.4 | 63.7 | San-Diego | 67.958333 |
| 0 | 2000 | 65.8 | 65.3 | 63.7 | 67.7 | 69.1 | 72.4 | 73.5 | 76.3 | 75.5 | 69.5 | 66.0 | 66.9 | San-Diego | 69.308333 |
| 0 | 1999 | 65.2 | 64.9 | 63.6 | 64.6 | 64.4 | 66.9 | 72.7 | 72.7 | 71.4 | 77.7 | 67.4 | 67.6 | San-Diego | 68.258333 |
| 0 | 2003 | 71.4 | 64.6 | 66.5 | 65.2 | 66.9 | 67.4 | 74.3 | 77.5 | 74.0 | 73.1 | 67.4 | 64.6 | San-Diego | 69.408333 |
| 0 | 2001 | 62.2 | 61.7 | 63.7 | 63.6 | 67.5 | 72.0 | 73.0 | 73.5 | 73.2 | 71.1 | 66.9 | 63.3 | San-Diego | 67.641667 |
# Sort the data by year for nicer plotting
all_data.sort_values("Year", inplace=True)
f, ax = plt.subplots()
for title, group in all_data.groupby('location'):
    group.groupby('location').plot(x='Year',
                                   y='annual_average_temp',
                                   title="Annual Average Temperature ºF",
                                   label=title,
                                   style='.--',
                                   ax=ax,
                                   alpha=.8)


ax.set(xlabel="Year", ylabel="Temperature (F)", xticks=[1999, 2000, 2001, 2002, 2003])

plt.show()
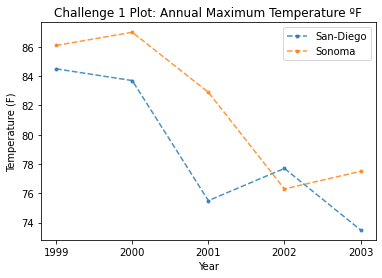
Challenge 1: Plot Temperature by Maximum Value
Above, you summarized the year by the average temperature for each year, plotted the
two locations to compare their average annual temperatures. In this challenge, plot
the maximum annual temperature for each location annually. Your graph should look
similar to the one above, but it should display the maximum annual temperature instead
of the average. You can use a similar method to getting the average to get the maximum
temperature. Using max instead of mean of the just_monthly_data_df should return
a series of data that’s the maximum values, which you can then assign to a column in the
main dataframe and plot like above.
# Create data and plot answer here
Share on
Twitter Facebook Google+ LinkedIn
Leave a Comment