Lesson 2. Open, Plot and Explore Lidar Data in Raster Format with Python Spatial data open source python Workshop
Learning Objectives
After completing this tutorial, you will be able to:
- Open a lidar raster dataset in
Pythonusingrasterioand a context manager to handle file connections. - Be able to identify the resolution of a raster in
Python. - Be able to plot a lidar raster dataset in
Pythonusingmatplotlib.
What You Need
Download spatial-vector-lidar data subset (~172 MB)
You will need a computer with internet access to complete this lesson. If you are following along online and not using our cloud environment:
Get data and software setup instructions here
You will need the Python 3.x Anaconda distribution, git and bash to set things up.
In this lesson, you will learn how to open a plot a lidar raster dataset in Python.
What is a Raster?
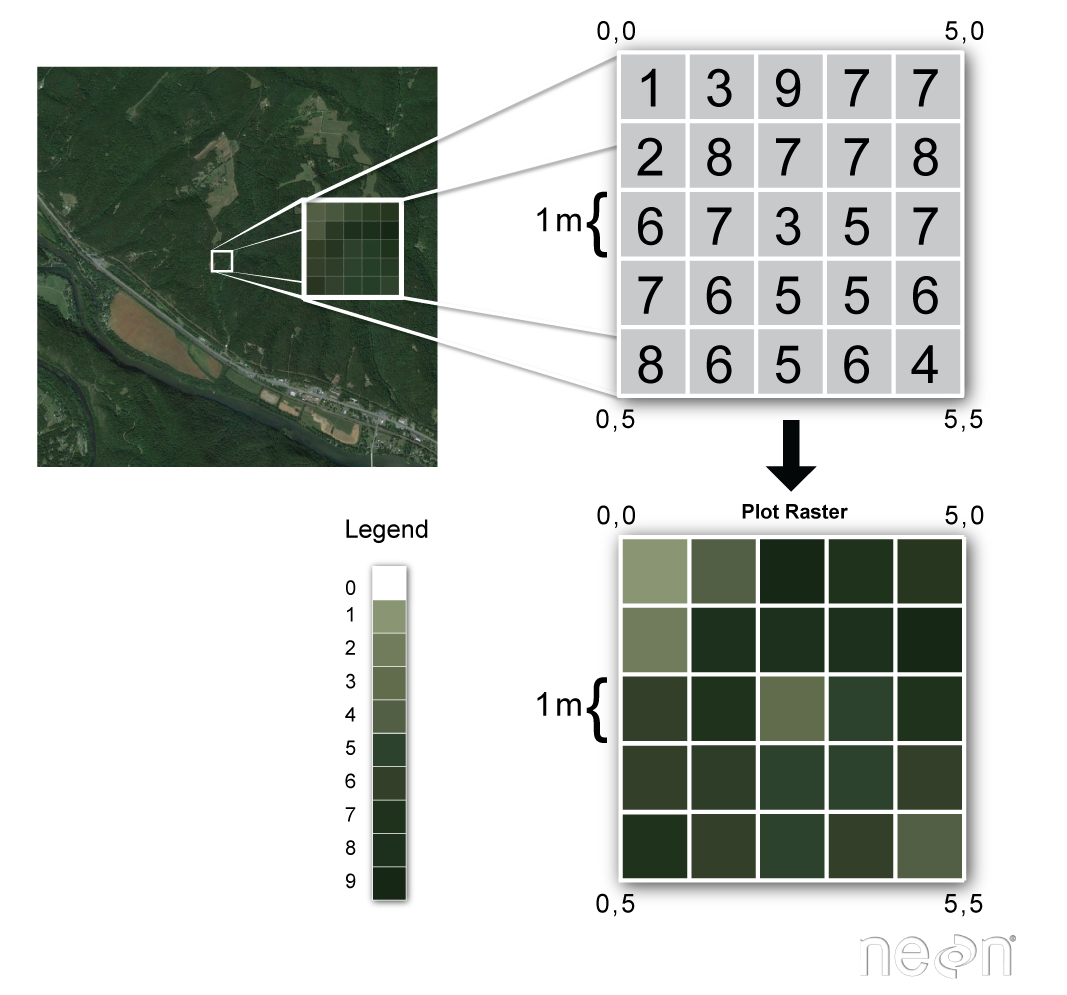
Raster or “gridded” data are stored as a grid of values which are rendered on a map as pixels. Each pixel value represents an area on the Earth’s surface. A raster file is a composed of regular grid of cells, all of which are the same size. You’ve looked at and used rasters before if you’ve looked at photographs or imagery in a tool like Google Earth. However, the raster files that you will work with are different from photographs in that they are spatially referenced. Each pixel represents an area of land on the ground. That area is defined by the spatial resolution of the raster.
Raster Facts
A few notes about rasters:
- Each cell is called a pixel.
- And each pixel represents an area on the ground.
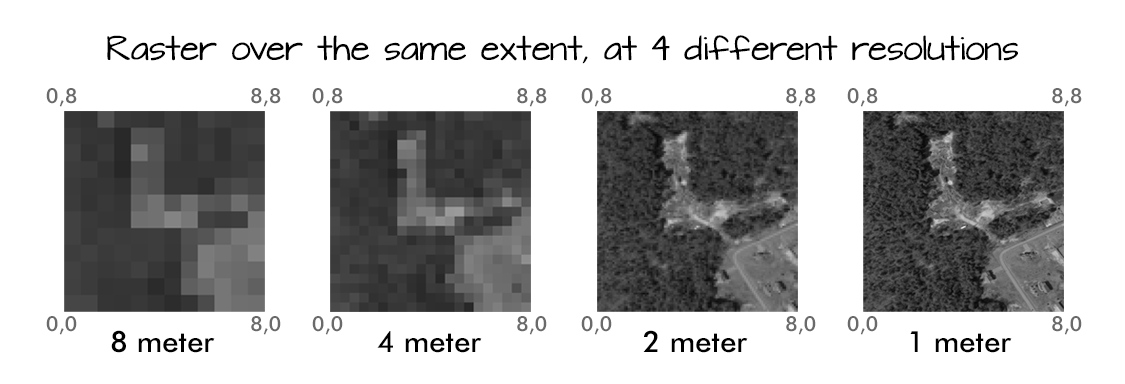
- The resolution of the raster represents the area that each pixel represents the area it represents on the ground. So, a 1 meter resolution raster, means that each pixel represents a 1 m by 1m area on the ground.
A raster dataset can have attributes associated with it as well. For instance in a LiDAR derived digital elevation model (DEM), each cell represents an elevation value for that location on the earth. In a LIDAR derived intensity image, each cell represents a LIDAR intensity value or the amount of light energy returned to and recorded by the sensor.
Open Raster Data in Python
You can use the rasterio library combined with numpy and matplotlib to open, manipulate and plot raster data in Python. To begin you will load a suite of python libraries required to complete this lesson. These libraries are all a part of the earth-analytics-python environment.
Be sure to set your working directory
os.chdir("path-to-you-dir-here/earth-analytics/data")
import os
import numpy as np
import matplotlib.pyplot as plt
import rasterio as rio
from rasterio.plot import show
from rasterio.plot import show_hist
from shapely.geometry import Polygon, mapping
from rasterio.mask import mask
# a package created for this class that will be discussed later in this lesson
import earthpy as et
import earthpy.spatial as es
import earthpy.plot as ep

# set home directory and download data
et.data.get_data("spatial-vector-lidar")
os.chdir(os.path.join(et.io.HOME, 'earth-analytics'))
Downloading from https://ndownloader.figshare.com/files/12459464
Extracted output to /root/earth-analytics/data/spatial-vector-lidar/.
Next, download the data. This line of code should only be run if you don’t have the data on your computer already!
Note that you import the rasterio library using the alias (or shortname) rio.
You use the rio.open("path-to-raster-here") function to open a raster dataset using rio in Python.
# define path to digital terrain model
sjer_dtm_path = "data/spatial-vector-lidar/california/neon-soap-site/2013/lidar/SOAP_lidarDTM.tif"

# open raster data
lidar_dem = rio.open(sjer_dtm_path)
# optional - view spatial extent
lidar_dem.bounds
BoundingBox(left=296906.0, bottom=4100038.0, right=300198.0, top=4101554.0)
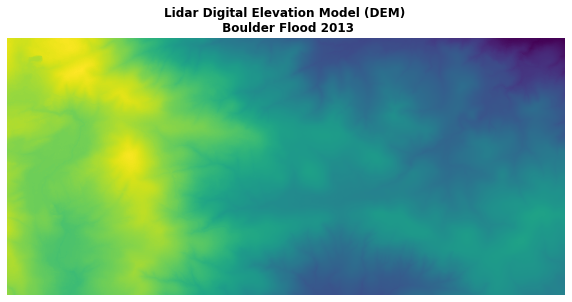
You can quickly plot the raster using the rasterio function, show().
# plot the dem using raster.io
fig, ax = plt.subplots(figsize = (10,8))
show(lidar_dem,
     title="Lidar Digital Elevation Model (DEM) \n Boulder Flood 2013",
     ax=ax)
ax.set_axis_off()
Opening and Closing File Connections
The rasterio library is efficient as it establishes a connection with the
raster file rather than directly reading it into memory. Because it creates a
connection, it is important that you close the connection after it is opened
AND after you’ve finished working with the data!
# close the file connection
lidar_dem.close()
# this returns an error as you have closed the connection to the file.
show(lidar_dem)

---------------------------------------------------------------------------
ValueError                                Traceback (most recent call last)
<ipython-input-7-dad244dfd7d3> in <module>()
      1 # this returns an error as you have closed the connection to the file.
----> 2 show(lidar_dem)

~/anaconda3/envs/earth-analytics-python/lib/python3.6/site-packages/rasterio/plot.py in show(source, with_bounds, contour, contour_label_kws, ax, title, **kwargs)
     80     elif isinstance(source, RasterReader):
     81         if source.count == 1:
---> 82             arr = source.read(1, masked=True)
     83         else:
     84             try:

rasterio/_io.pyx in rasterio._io.RasterReader.read (rasterio/_io.c:10647)()

rasterio/_io.pyx in rasterio._io.RasterReader._read (rasterio/_io.c:15124)()

ValueError: can't read closed raster file
Once the connection is closed, you can no longer work with the data. You’ll need to re-open the connection. Like this:
# open raster data connection - again
lidar_dem = rio.open(sjer_dtm_path)

fig, ax = plt.subplots(figsize = (10,10))
show(lidar_dem,
     title="Once the connection is re-opened \nyou can work with the raster data",
     ax=ax)
ax.set_axis_off()
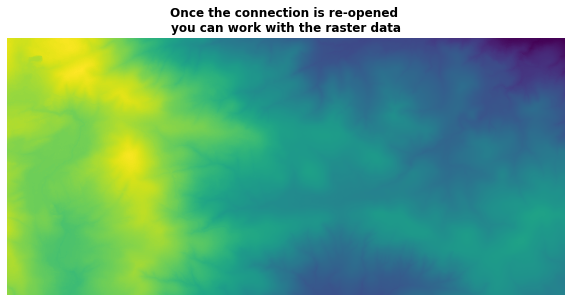
lidar_dem.close()
Context Manager to Open/Close Raster Data
A better way to work with raster data in rasterio is to use the context manager. This will handle opening and closing the raster file for you.
with rio.open('name of file') as scr:
    src.rasteriofunctionname()
# view spatial extent of raster object
with rio.open(sjer_dtm_path) as src:
    print(src.bounds)
BoundingBox(left=296906.0, bottom=4100038.0, right=300198.0, top=4101554.0)
Once you are outside of the with statement, you can no long access the src object which contains the spatial raster information.
Raster Plots with Matplotlib
Let’s try this again. Open the same DEM using a context manager. Then let’s plot again but this time using earthpy plot_bands. Using matplotlib allows you to fully customize your plots. Do the following
- use .read() to read in your raster data as a numpy array
- set masked = True to ensure that no data values get translated to
nan. - only read in the first band of your single band image. If you don’t specify
1when you read in a raster you will get a 3 dimensional array.
# read in all of the data without specifying a band
with rio.open(sjer_dtm_path) as src:
    # convert / read the data into a numpy array:
    lidar_dem_im = src.read(masked= True)

# view array shape -- notice that you have 3 dimensions below
print(lidar_dem_im.shape)
(1, 1516, 3292)
# specify a band so you get a 2 dimensional image array
with rio.open(sjer_dtm_path) as src:
    # convert / read the data into a numpy array:
    lidar_dem_im = src.read(1, masked= True)
    sjer_ext = rio.plot.plotting_extent(src)

# view array shape -- here you have a 2 dimensional array as you would expect to have
print(lidar_dem_im.shape)
(1516, 3292)
sjer_ext
(296906.0, 300198.0, 4100038.0, 4101554.0)
Plot A Raster Using EarthPy
You are now ready to plot your data using plot_bands and EarthPy.
ep.plot_bands(lidar_dem_im,
              cmap='Greys',
              extent=sjer_ext,
              cbar=False)

<matplotlib.axes._subplots.AxesSubplot at 0x7f6f2f558a90>
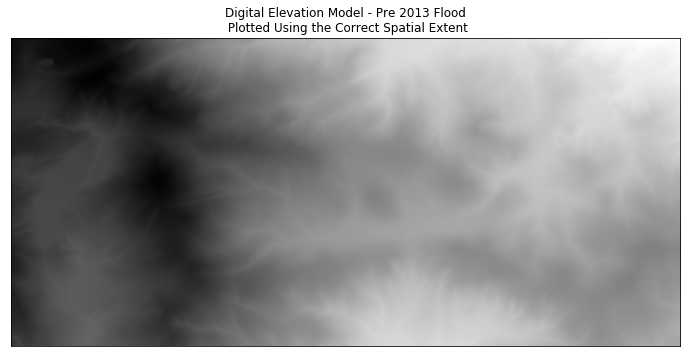
If you provide the spatial extent of the raster to the plot, it will be plotted in the correct spatial location. This is important if you plan to overlay another spatial data layer on top of your raster plot.
ep.plot_bands(lidar_dem_im,
              cmap='Greys',
              extent=sjer_ext,
              cbar=False,
              # Add a title arguement
              title="Digital Elevation Model - Pre 2013 Flood\n Plotted Using the Correct Spatial Extent")
plt.show()
Adding a ; at the end of the last line of your plot will
turn off the message that you might otherwise get from matplotline: Text(0.5,1,'Digital Elevation Model - Pre 2013 Flood')
ep.plot_bands(lidar_dem_im,
              cmap='Greys',
              extent=sjer_ext,
              title="Digital Elevation Model - Pre 2013 Flood\n Plotted Using the Correct Spatial Extent",
              cbar=False)
plt.show()

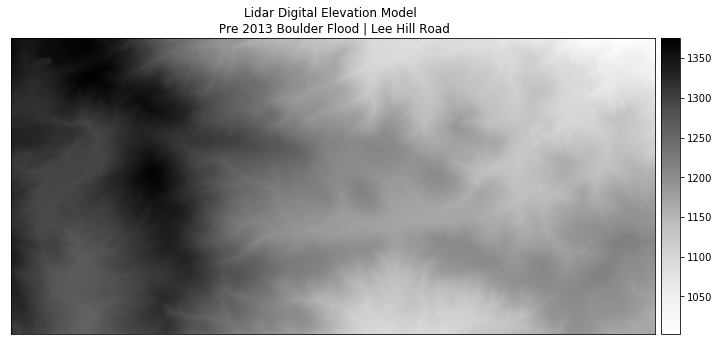
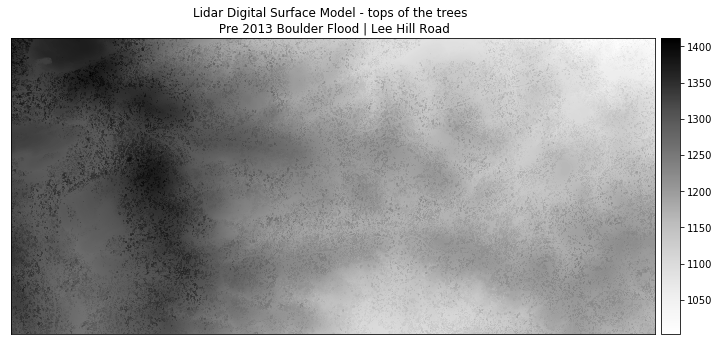
Let’s plot again but this time you will:
- add a colorbar by allowing
ep.plot_bands()to add one. You have been setting thecbararguement toFalsein the previous plots. The default forplot_bands()is forcbarto be set toTrue - fix the colorbar scaling. By default,
plot_bands()will scale a colorbar to a 0-255 scale. However, since you are looking at elevation data, you would like the original values of the raster. You can prevent this scaling by setting thescalearguement ofplot_bands()toFalse - turn off the annoying matplotlib message by adding a semicolon
;to the end of the last line
ep.plot_bands(lidar_dem_im,
              cmap='Greys',
              extent=sjer_ext,
              title="Lidar Digital Elevation Model \n Pre 2013 Boulder Flood | Lee Hill Road",
              scale=False)
plt.show()
Below you tweak the height of your colorbar to ensure it lines up with the top and bottom edges of your plot. To do this you use the make_axes_locatable package from the mpl_toolkits.axes_grid1 library.
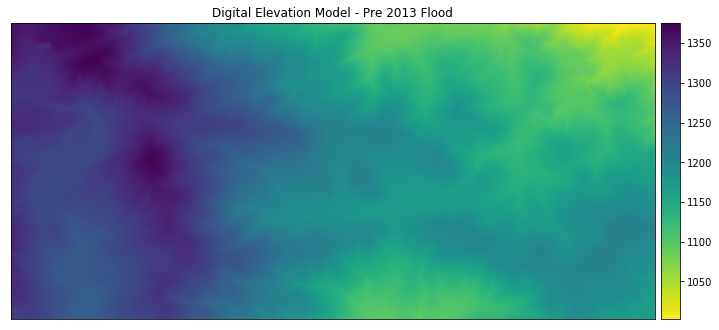
Color Ramps
To plot you can select pre-determined color ramps from matplotlib, you can reverse a color ramp by adding _r at the end of the color ramps name, for example cmap = 'viridis_r'.
ep.plot_bands(lidar_dem_im,
              cmap='viridis_r',
              extent=sjer_ext,
              title="Digital Elevation Model - Pre 2013 Flood",
              scale=False)
plt.show()
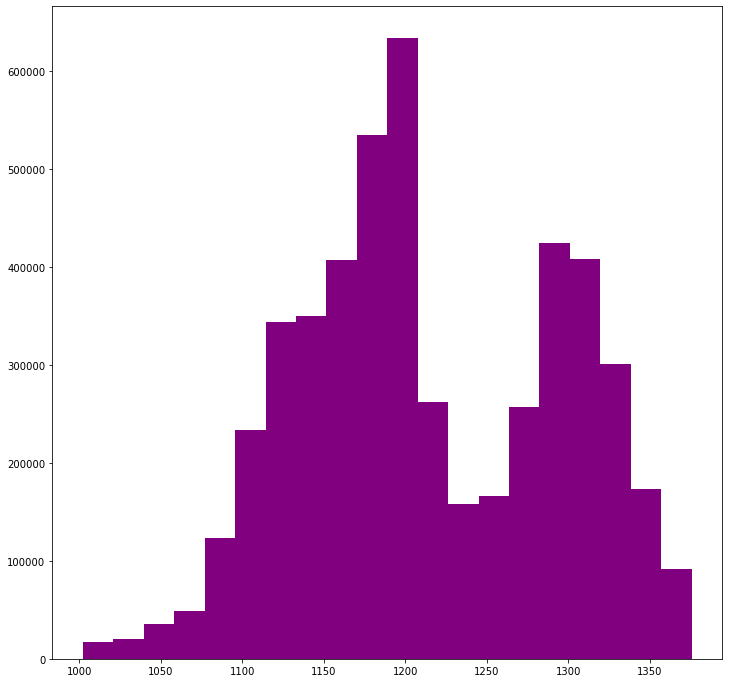
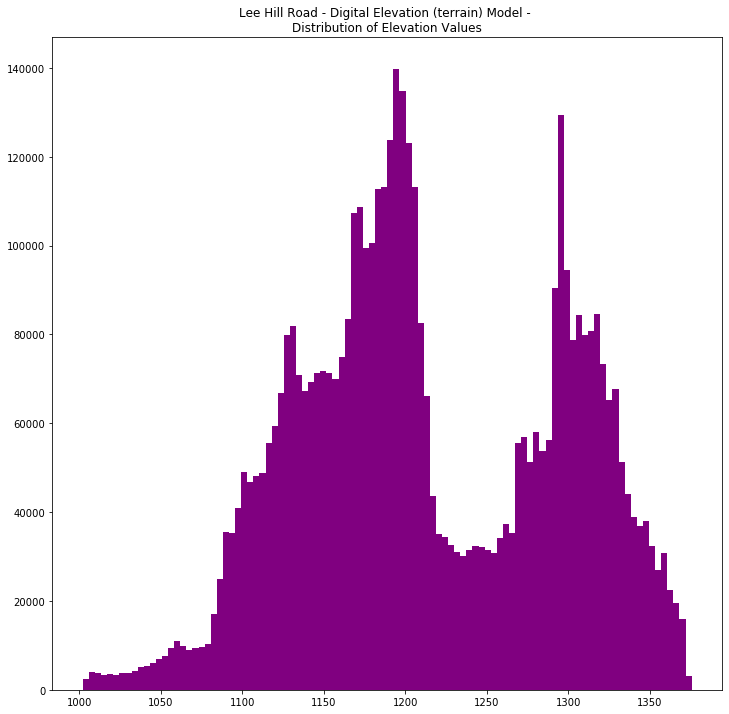
Explore Raster Data Values with Histograms
Next, you will explore a histogram of your data. A histogram is useful to help you better understand the distribution of values within your data. In this case given you are looking at elevation data, if there are all small elevation values and the histogram looks uniform (not too much variation in values) you can assume that your study area is relative “flat” - not too hilly. If there is a different distribution of elevation values you can begin to understand the range of elevation values in your study area and the degree of difference between low and high regions (ie is it flat or hilly?). Is it high elevation vs low elevation?
To plot a histogram use the earthpy.plot - hist() function.
# create histogram of data
ep.hist(lidar_dem_im)
plt.show()
# create histogram of data
ep.hist(lidar_dem_im,
        bins=100,
        title="Lee Hill Road - Digital Elevation (terrain) Model - \nDistribution of Elevation Values")
plt.show()
On Your Own - Challenge
The file that you opened above was an elevation model representing the elvation of a field site in California. Next, open up and plot the file: "data/spatial-vector-lidar/california/neon-sjer-site/2013/lidar/SJER_lidarDSM.tif". If you want, produce a histogram of the data to better understand the range of elevation values in your data.
Share on
Twitter Facebook Google+ LinkedIn