Lesson 5. Python Fundamentals Exercise
Learning Objectives
This page of exercises will test the skills that you learned in the previous lessons in this chapter.
Challenge 1: Create Lists from Data
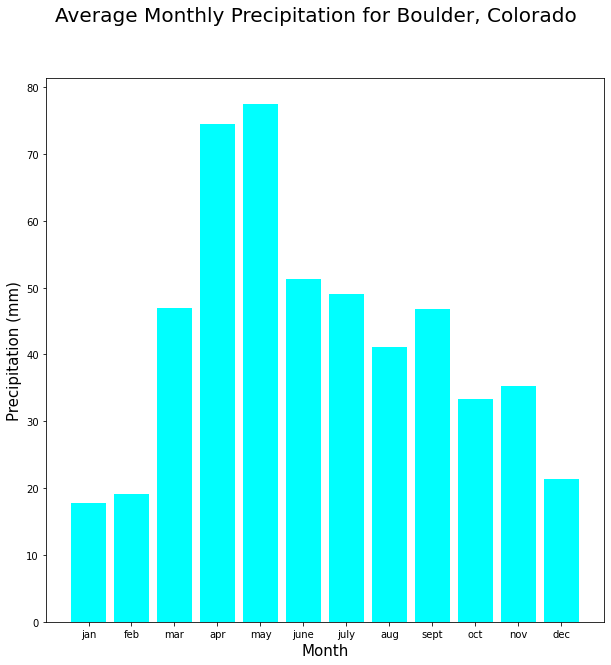
The data below represent average monthly precipitation for Boulder, Colorado provided by the U.S. National Oceanic and Atmospheric Administration (NOAA).
| Month | Precipitation (inches) |
|---|---|
| jan | 0.70 |
| feb | 0.75 |
| mar | 1.85 |
| apr | 2.93 |
| may | 3.05 |
| june | 2.02 |
| july | 1.93 |
| aug | 1.62 |
| sept | 1.84 |
| oct | 1.31 |
| nov | 1.39 |
| dec | 0.84 |
Create two Python lists as follows:
- the first list should contain the month abbreviations and should be called
boulder_precip_months. - the second list should be a list of precipitation values and should be called
boulder_precip_inches.
Both lists should contain the data in the table above, in the order they appear in the table above! Here are all of the data formatted to make it easier for you to create your list!
0.70, 0.75, 1.85 , 2.93, 3.05 , 2.02, 1.93, 1.62, 1.84, 1.31, 1.39, 0.84
And here are the months:
jan, feb, mar, apr, may, june, july, aug, sept, oct, nov, dec
HINT: the month values should be strings and the precipitation values should be floating point numbers!
Challenge 2: Modify Values in Existing List
Next, convert each floating point value in the boulder_precip_inches to millimeters by creating a new list variable called boulder_precip_mm. One way to do this is to create a copy of the old list and assign it to a new variable name - like this:
new_list = old_list.copy()
HINT: There are several efficient ways of converting your data to mm including list comprehensions.
For this exercise, you can begin by making a copy of the boulder_precip_inches object using:
boulder_precip_inches.copy()
Reassign that copy to the new variable called boulder_precip_mm. Then, you can replace each value in your new list using indexing. Refer back to the lesson on lists if you do not remember how to replace a value in a list. To convert inches to millimeters, you need to multiply the inches by 25.4 (1 inch = 25.4 mm). To make your code more legible, you can create a variable at the top of your notebook that stores the conversion value of 25.4. A well named conversion variable will make your code easier to manage and easier to read.
Challenge 3: Create a List of Lists
You can make a list of lists (a list which contains multiple sublists) using the following syntax:
list_of_lists = [list_one, list_two]
In the cell below, create a list called all_boulder_data that contains the boulder_precip_months and boulder_precip_mm objects as sublists.
# Creating the list of lists

all_boulder_data = [boulder_precip_months, boulder_precip_mm]
Challenge 4: Plot the Data in the List of Lists
Modify the following code to create a plot of your data. Be sure to use the all_boulder_data object for your plot:
HINT: you will need to properly index the all_boulder_data object to access each sublist within it.
# Import necessary plot package
import matplotlib.pyplot as plt

# Plot monthly precipitation values
fig, ax = plt.subplots(figsize=(6, 6))
ax.bar(listname_x_axis,
       listname_y_axis,
       color="red")
ax.set(title="Add plot title here",
       xlabel="Add x axis label here",
       ylabel="Add y axis label here")
plt.show()
Customize this plot by completing the following tasks:
- Replace
listname_x_axisandlistname_y_axiswith the appropriate sublist within theall_boulder_datalist. - Change the color of the plot to a blue color such as aqua.
- Update the text for the titles and axes labels.
- Modify the values in
figsize=(6, 6)to change the size of your plot.
For your titles and labels, be sure to think about the following pieces of information that could help someone easily interpret the plot:
- geographic coverage or extent of data.
- duration or temporal extent of the data.
- what was actually measured and/or represented by the data.
- units of measurement.
BONUS Challenge: List Comprehensions in Python
Above you performed many tasks manually. Included in those manual steps was one where you converted each individual value in your list from inches to mm. In Python, list comprehensions are a great way to perform operations on a sequence of values stored within a list.
The syntax for a list comprehension is below. Essentially what is happening is that Python is iterating through each value in the old list (for i in my_old_list) and multiplying it by 2 (i*2). In each iteration of the loop, the value i represents the next value in the list. In the example below, i will first be the value 1, and then 2, and finally 3.
my_old_list = [1, 2, 3]
my_new_list = [i *2 for i in my_old_list]
my_new_list will equal each value in my_old_list multiplied by 2, so my_new_list will be equivalent to [2, 4, 6]. You can run this code and see the output for yourself! Try to experiment with writing more efficient code. Convert your boulder_precip_inches list of values to a new list called boulder_precip_mm using a list comprehension. Use the syntax above to help you create this list comprehension.
For more information on loops and changing values within a list, you can check out Earth Lab’s lesson introducing loops in Python, and you can go to this more in depth explanation on list comprehensions in Python.
Share on
Twitter Facebook Google+ LinkedIn
Leave a Comment