Lesson 2. Get Landsat Remote Sensing Data From the Earth Explorer Website
Learning Objectives
After completing this tutorial, you will be able to:
- Find and download data from the USGS Earth Explorer Website.
- Filter data by cloud cover to find datasets with the least amount of clouds for a study area.
What You Need
You will need a computer with internet access to complete this lesson and the data for week 8 of the course.
In class this week, you will review how to grab data from the Earth Explorer website. The Earth Explorer website is a data portal run by the USGS. Here you can find many different types of remote sensing and other data for both the US and in some cases, the globe.
IMPORTANT: Be sure to order your data several days ahead of time or else you won’t have it in time to finish your homework.
How to Download Landsat Remote Sensing Data from Earth Explorer
Step 1: Define Your Study Area (AOI)
When searching for data, the first thing that you need to do is to define your area of interest (AOI). Your AOI for this week, is defined by the boundary of the Cold Springs fire extent. You could type in the x,y vertices of each corner of the boundary, but if you have an Earth Explorer account, you can upload a ZIPPED up shapefile that contains the boundary instead.
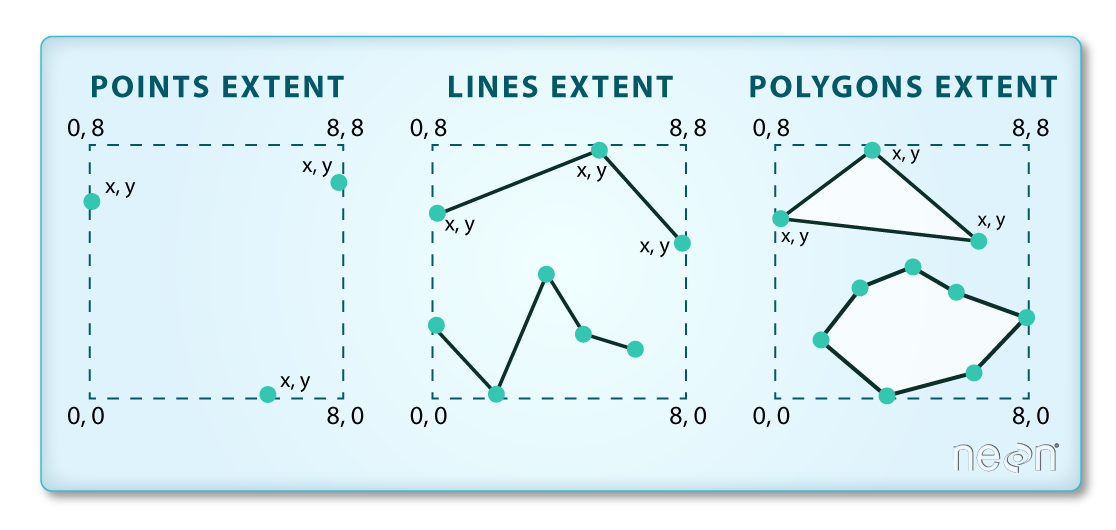
Important: Be sure to use a square / rectangular extent polygon. If you have too many vertices in your extent polygon, the website won’t accept it as an extent file.
To define your AOI in Earth Explorer:
- Zip up extent file that you want to use. Be sure to use a square extent, if you
have too many vertices it won’t work. Lucky for us there is a zip file already zipped
up and ready to go in your week 8 data!
data/week-08/vector_layers/fire_boundary_box_shp.zip - Next, go to the Earth Explorer website. Login. If you don’t have a login already, create an account.
Be sure to create an account. You will need it to be able to use your shapefile extent to search for data. Now, it’s time to search for data.
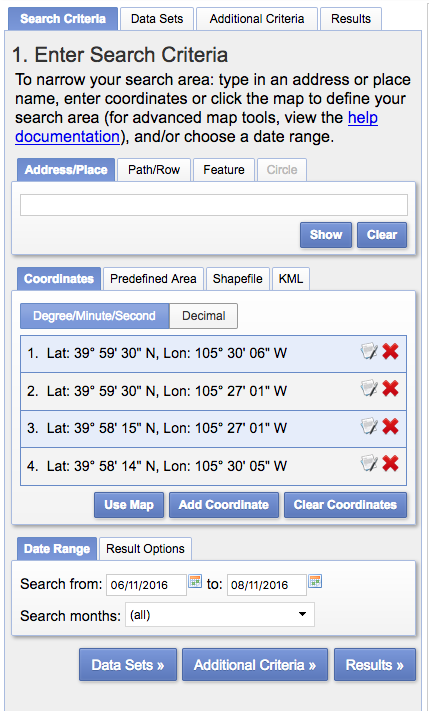
- In the search criteria, click on shapefile tab. Select the zip file above as the shapefile that represents the SPATIAL EXTENT of your study area - the Cold Springs fire site.
- At the bottom of the search criteria window, select a range of dates. A month before and after the fire is a nice starting point.
Step 2: Define the Data That You Want to Download
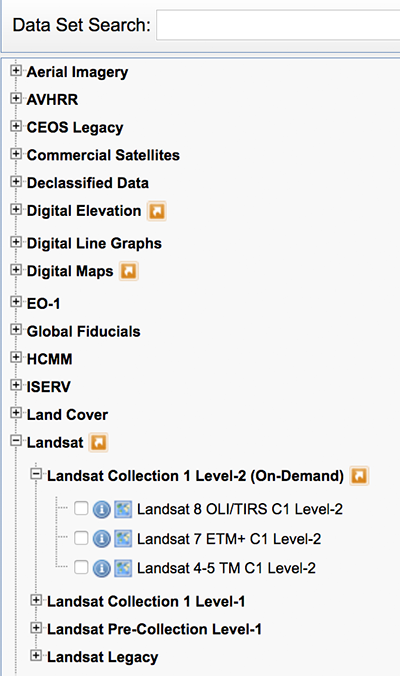
- Next click on the Data sets tab. Notice that there are a lot of different data available from Earth Explorer! You are interested in Landsat - specifically Landsat 8. You can find Landsat in the Landsat archive drop down. Expand that drop down to find:
- Landsat - Landsat Collection 1 Level-2 (On-Demand)
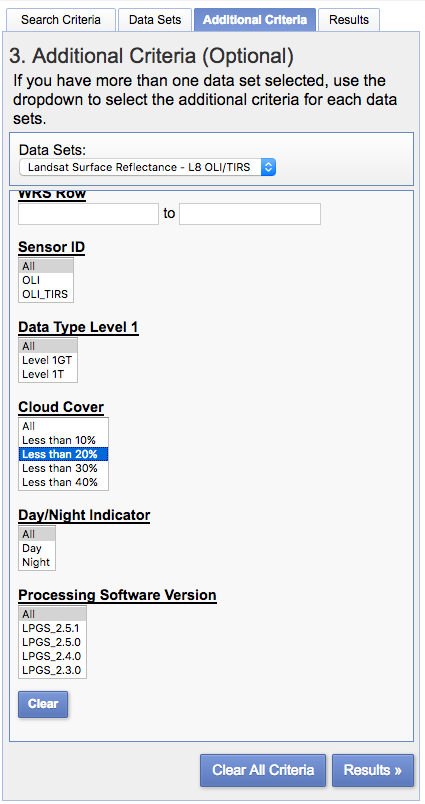
Step 3: Define Selection Criteria
- Next select the Additional Criteria tab. Here is where you can limit results by % cloud cover. Start with Less than 20% cloud cover and see what you get as data results.
Step 4: View Results & Select Data to Order / Download
- Finally click on the Results tab. Here you see all of the scenes available for “order” from the website that cover your study area.
- Notice that you can click on the icons below the scene to see the scene itself rendered on the map and to see the footprint (or extent) of the scene relative to your study area.
- Pick a scene that is:
- closest to the pre-fire date (July 10 2016) and also that has the least amount of cloud cover close to your study area.
Step 5: Order Your Data
- Click the shopping cart icon to add the data to your cart.
- Click on “item basket” in the upper right hand corner of your browser to see what you have ordered.
- Click on Proceed to Checkout
- Then finally, click on Submit Order
IMPORTANT: It will take a few days for the link that you can use to download your data to be emailed to your account. Order now!
Explore Newly Downloaded Data
In this case, you want to download a scene very close to Julian day 189. An example of what the data look like is below. Notice that the spatial extent of the data that you download from Earth Explorer is much broader than the data that you worked with for your homework last week. The extents are different because your instructor cropped the class data to make is easier to work with!
Import New Scene
First, let’s import your new data and create a raster stack. The code is hidden because you already know how to do this!

Next, plot the fire boundary extent on top of the newly downloaded Landsat 8 image.

If you look closely at the image above, you’ll see the tiny yellow boundary that represents the Cold Springs fire boundary. This landsat scene is MUCH larger than your Cold Springs Fire study area. You have 2 options:
- Crop the data: this will make it easier to work with as it will be smaller. A good move.
- Plot only the study area extent: this is ok if you just want to plot your data and don’t need to do any additional processing on it.
Below i’ve plotted the cloud mask for the data that I downloaded. It looks like the data in your study area are cloud free. How do I know that?

All of the pixels within your study area are cloud free. This means you have downloaded the right scene. This also means that you don’t have to worry about applying a cloud mask to the data.
# turn axes to white
par(col.axis = "white", col.lab = "white", tck = 0)
# plot RGB
plotRGB(all_landsat_bands_173_st,
        r = 4, g = 3, b = 2,
        stretch = "lin",
        main = "Final landsat scene with the fire extent overlayed",
        axes = TRUE)
box(col = "white")
plot(fire_boundary_utm,
     add = TRUE,
     border = "yellow")

Now that you have some cloud free data covering the study area, you can proceed to calculate NBR on the pre-fire data.
Share on
Twitter Facebook Google+ LinkedIn
Leave a Comment